Are you looking for a reliable source to prepare for your AKTU B.Tech Surveying and Geomatics exam? Look no further than our last year question paper with solution Quantum PDF Notes. With these notes, you’ll get access to a comprehensive set of questions from previous exams, complete with step-by-step solutions to help you understand each problem. Plus, our Quantum PDF format makes it easy to study on-the-go, so you can fit exam prep into your busy schedule. From basic surveying principles to advanced geomatics concepts, our notes cover everything you need to know to succeed on exam day. So why stress about the exam? Download our last year question paper with solution Quantum PDF Notes for Surveying and Geomatics and prepare to ace your AKTU B.Tech exam!
Dudes 🤔.. You want more useful details regarding this subject. Please keep in mind this as well.

Important Questions For Surveying And Geomatics:
*Unit-01     *Unit-02
*Unit-03    *Unit-04
*Unit-05    *Short-Q/Ans
*Question-Paper with solution 21-22
Section A: Short Important Question surveying and geomatics
a. What are the initial and final Sub-cords?
Ans.
- Initial Sub-cords: When a curve’s first tangent point’s chainage is an odd number, length is typically added to make it a round number. The length is specified for the initial sub-chord.
- Final Sub-cords: The first sub-chord is followed by several full chords (20 or 30 m). It can take a fractional length to reach the second tangent point at the end of the curve. This length characterizes the last subchord.
b. Define Surveying and write down its principles?
Surveying:
Surveying is the process of determining the relative position of points on, above, or below the surface of the earth with respect to one another by utilizing direct or indirect measurements of distance, direction, and elevation.
Importance:
- The planning and design of all civil engineering projects, such as the construction of roads, bridges, tunnels, dams, etc., is based on measurements obtained during the surveying process.
- Any size project is built along the lines and points determined by surveying.
- Surveying is used to fix the national and state boundaries.
- Surveys are used to map navigable coastlines, lakes, and streams.
- Hydrographic and oceanographic charting and mapping are carried out through surveying.
- A topographic map of the earth’s land surface is created via surveying.
Principles:
Following are the two basic principles of surveying:
- To work from whole to part.
- To locate a point by at least two measurements.
c. What do you understand by terms degree of a curve?
Ans: The angle that a standard chain of 30 m length subtends at the curve’s centre is the curve’s degree.
d. What is difference between accuracy and precision?
Ans:
| Accuracy | Precision |
| Accuracy is the degree of quality obtained in any work. | Precision is the level of care and dexterity used to carry out any physical measurement. |
| All measurement mistakes, including systematic errors, are considered to be included in its comprehensive estimate. | It only takes chance into account and demonstrates how repeatable a measurement is. |
e. Differentiate between active and passive sensor.
Ans:
| Active Sensor | Passive Sensor |
| Active sensors are those that independently produce electromagnetic energy at a certain wavelength. | While passive sensors do not produce their own electromagnetic energy, they do detect natural radiation. |
| Example: Flashphotography, radar, etc. | Example: Available light photography sensing during bright sunlight. |
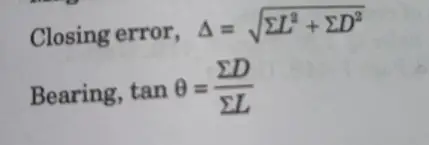
f. Explain the term closing error. How do you find its magnitude and bearing?
Ans.
Closing Error: It is the gap that keeps the beginning and end of a traversal from colliding.Magnitude and Bearing :
G. Explain the basic Principle of Tacheometry.
And: Tacheometry makes it feasible to determine the horizontal and vertical lengths from information on a stadiometer, eliminating the need for chaining processes.
h. What do you understand by ?
Ans: Photogrammetric surveying, often known as photogrammetry, is the art and science of using photographs to make precise measurements.
i. Explain the term “Electromagnetic Spectrum”?
Ans: The electromagnetic spectrum is a collection of wave lengths, frequency ranges, and photon energies, with wavelengths ranging from a few kilometres to a small fraction of the size of an atomic nucleus, and frequencies ranging from 1 Hz to 1025 Hz.
j. Explain the principle on which radar works?
Ans: Retracing the portion of the radio wave that was emitted and reflected when it struck the surface of a hard object is how radar typically works.
Section B : Long Question
2A. What do you understand by image classification ? Write short notes on EDM Equipment?
Image Classification:
- Assigning land cover classes or themes to each pixel in an image is the aim of image classification.
- In order to classify images, pixels are sorted into a finite number of discrete classes based on their DN values in a certain spectral band.
Each homogeneous group, which functions as a sort of thematic map of the original image, depicts a certain type of land cover or feature, such as water coniferous trees, deciduous woodlands, corn, wheat, etc.
Classification Procedures: Common classification procedures are:
1 Supervised Classification:
- The information class is initially specified on the image. The analyst’s selection of information classes is based on his or her familiarity with the region and knowledge of the actual surface and cover types visible in the image, as though they are supervising the categorization of a collection of information classes.
- Information classes are referred to as “training areas.” Using the DN values of all the spectral bands that make up the information class, the computer is trained to distinguish spectrally comparable regions for each class.
- The computer utilises algorithms to figure out each “training area’s” “class signatures.”
- The computer then uses these spectral signatures to compare each pixel in the image to the class that it most closely resembles.
2. Unsupervised Classification:
- It generally flips the script on the supervised categorization process. After being categorised according to DN values, information classes are next matched to spectral classes.
- The algorithm examines the pixels, classifying them into several spectral groupings (clustering algorithm).
- The analyst chooses how many groups or clusters to examine in the data.
- Additionally, the analyst can specify limits for both the variance inside each cluster and the separation between them.
- Finally the analyst may decide to combine some clusters or breakdown others.
- Unsupervised classification does not start with a predetermined set of classes, in contrast to supervised classification.
EDM Equipment :
EDM:
1. An electronic distance measuring device is a surveying tool that uses electromagnetic waves to electronically measure the distance between two sites.
2. In electronic distance measuring (EDM), phase changes that occur as electromagnetic energy waves travel from one end of the line to the other are utilised to calculate the separation between two sites.
B. Measuring Method: Following are three methods of measuring distance between two points:
1. DDM or Direct Distance Measurement: This is mainly done by chaining or taping.
2. ODM or Optical Distance Measurement: This measurement is made via tacheometry, telemetry, or the horizontal subtense technique. These are finished with the help of optical wedge attachments.
3. EDM or Electromagnetic Distance Measurement: The direct distance measurement approach is ineffective on uneven ground.
When there are major obstacles or when the ground is uneven, this strategy should be avoided.
Types of EDM Instruments: Depending upon the type of carrier wave employed, EDM instruments can be classified under the following heads:
- Microwave Instruments:
- These devices are within the category of long-range devices, which employ carrier frequencies in the 3 to 30 GHz (1 GHz = 109) range to measure distances up to a range of 100 km. The tellurometer falls within this category.
- Phase comparison technique is used for distance measurement.
- The remote instrument is the same as the master instrument.
- instrument placed at the measuring end.
- Visible Light Instruments:
- These instruments use visible light as a carrier wave, with a higher frequency, of the order of 5 × 10¹⁴ Hz.
- Because a carrier wave at such a high frequency rapidly loses transmission power with distance, these EDM instruments have a shorter range than microwave devices.
- A geodimeter comes under this category of EDM instruments.
- The carrier, which is conveyed as a light beam, is focused on a signal using a lens or mirror system to prevent signal loss.
- Infrared Instruments:
- The EDM equipment in this category uses the near infrared radiation band, which has a wavelength of around 0.9 um and is easily produced using gallium arsenide (Ga As) infrared emitting diodes.
- It is very easy to directly amplitude modulate these diodes at high frequencies. This modulated carrier wave was created with a low-cost method.
- Due to the reason, there is predominance of infrared instruments in EDM.
- Wild Distomats fall under this category of EDM instruments.
c. What are object and fields based models? Differentiate between vector and raster data formats.
Ans: Object and Field Based Models /
- Data Model:
- Data models are methods of representing data. The data model depicts the connections between the computer and the real-world realm of geographic data (or GIS representation of the features).
- The process of linkages involves :
- Recognising and conceptually modelling the spatial elements from the real world that apply to a particular application.
- Use raster or vector approach to represent conceptual model.
- Selecting an appropriate spatial data structure to store the model within the computer.
- B. Types of Data Model: Following are two types of data model:
- Object-based Model:
- In object-based model, the geographic space is to be filled by discrete and identifiable objects.
- An object with spatial characteristics, recognisable bounds, relevance to a particular intended use, and the ability to be described by one or more characteristics is said to have attributes.
- Field-based Model:
- Geographic space in a field-based model is populated by one or more spatial phenomena from the real world, but they do not have a clear or defined extent.
- Aerial photography, remote sensing, and map scanning can all be used to directly or indirectly collect data regarding spatial phenomena.
- Object-based Model:
- Difference: Following are the differences between object and field data model:
| Object Data Model | Field Data Model |
| It deals with object oriented blue print of the system. | It deals with spatial phenomena of real-world. |
| It defines how the application interacts with the information received from an external source. | It defines how table and fields store each individual piece of data. |
| A vector data structure is an object based implementation. | A raster data structure is a field based implementation. |
d. Describe the function of different parts of an aerial camera with the help of a neat sketch. Also differentiate between angle of tilt and angle of swing.
Ans: Aerial camera consists of following three basic components:
Magazine:
- The camera holds the roll of undeveloped film, advances it between exposures, stabilises it, and wraps up the exposed film.
- The film is moved continuously past a small slit called format opening in the focal plane.
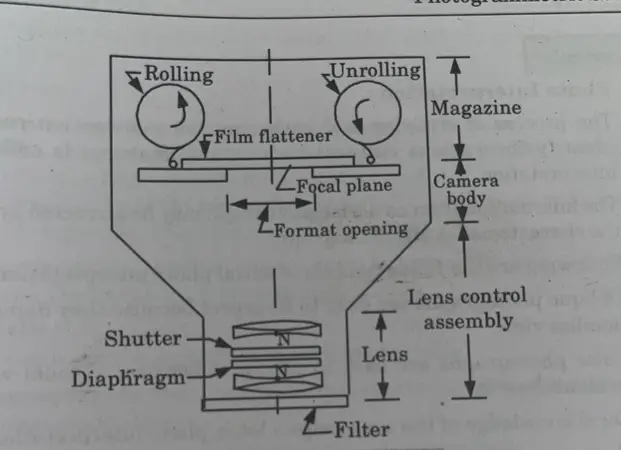
Camera Body :
- The component of the camera located at the tip of the cone is called the camera body.
- When this happens, they play a crucial role in maintaining the inner orientation of the cone once the camera has been calibrated.
Lens Cone Assembly: It has following components:
- Lenses: The most crucial component of an aerial camera is the lens. The lenses used in aerial cameras are very high-quality compound lenses. Lenses concentrate on the focal plane by collecting light from surrounding objects.
- Filter: It is offered before the lens. It lessens the effects of air haze, shields the lens from dust, and distributes light evenly across the format.
- Shutter: It regulates the exposure time based on aircraft speed to provide sharp photos.
- Diaphragm: By adjusting the aperture size, it may regulate how much light enters the lens. Normally, it is positioned in the empty space between the lens components.
Difference:
| Angle of Tilt | Angle of Swing |
| It is a vertical angle formed at the exposure station when the optical axis crosses the plumb line. It is located in the main plane. | It is the horizontal angle, measured anticlockwise in the photograph’s plane, between the photo’s nadir point and the positive Y-axis direction. |
e. What are the different characteristics of Contours? Also explain the uses of contour maps.
Ans: Characteristics:
Contour:
- A contour is a hypothetical line that passes across places with the same elevation. As a result, contour lines on a plan show how the ground is conformed.
- Submarine contours, fathoms, or bathymetric curves are the names given to the curves when they are drawn underwater.
- Usually the contours are not visible on the grounds except in the case of shorelines.
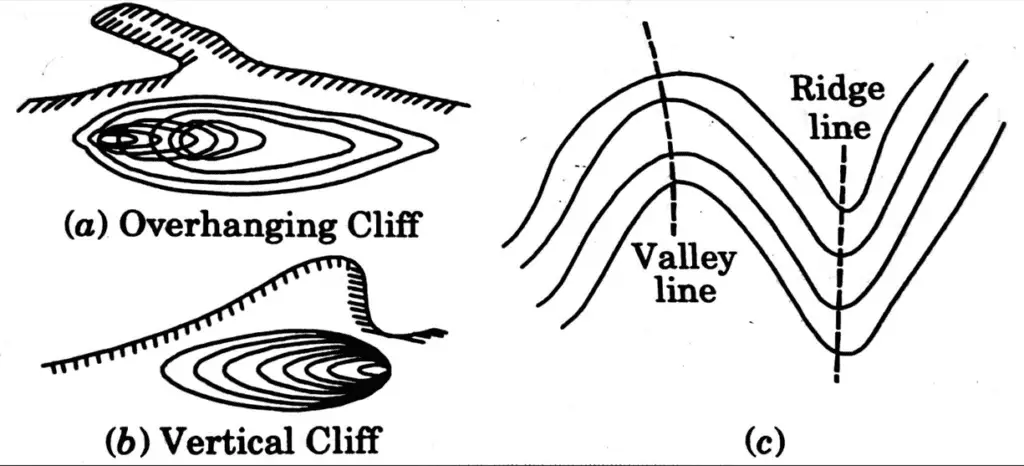
Characteristics: Following are the characteristics of contour :
- Contours are smooth curves.
- Except in the instance of an overhanging cliff or a tunnel that pierces a hillside, no two contours cross each other.
- A contour line must close on to itself, not necessarily within the limits of a map.
- Because the perpendicular distance between contour lines is the shortest, contours are parallel to the line of sharpest slope.
- Close contour lines indicate steep slope.
- Wide spaced contour lines indicate gentle slope.
- Contour lines equally spaced indicate uniform slope.
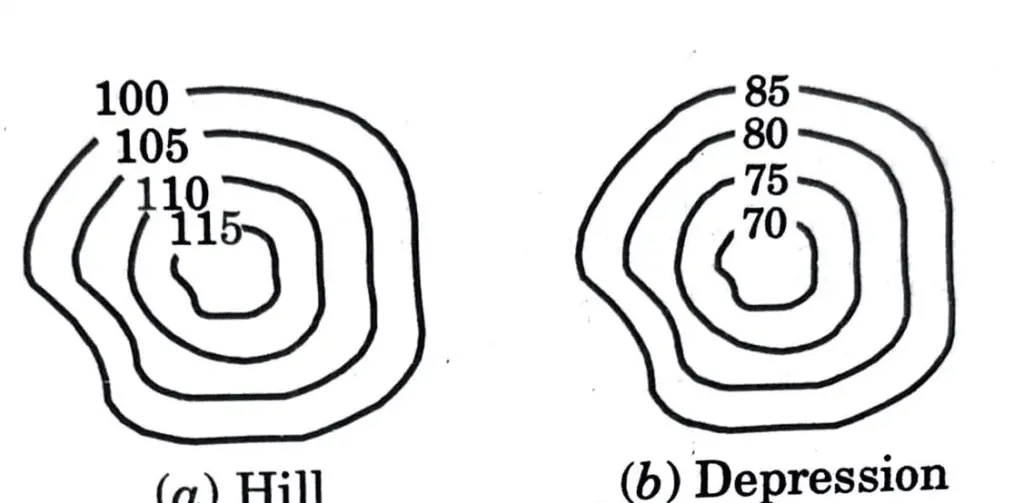
- A closed contour with higher ones within it represents a hill as shown in Fig
- A closed contour with lower ones within it represents a pond, lake or a depression as shown in
- The contours form a sort of U shape with the concave side on the higher side in the case of ridges and the concave side on the lower side in the case of valleys, as illustrated in the figure below. Ridges and valleys (lines) are perpendicular to the contours.
Uses of Contour Maps: Following are the important uses of contour map.
- To draw sections along a line.
- To determine intervisibility of triangulation stations.
- To know location of route.
- To mark water sheds and drainage lines.
- To measure drainage area or catchment area of a river.
- In the calculation of capacity of a reservoir.
Section C: Important Question in Surveying And Geomatics
a. Explain different spectral classes. Discuss the process of supervised and unsupervised classification.
Ans: Spectral Class :
1. In the various spectral channels of the data, pixel groups that are uniform (or nearly comparable) in terms of their brightness values are referred to as spectral classes.
2. Following are the types of spectral classification :
- Supervised Classification: When performing supervised classification, we begin by designating an information class for the image. The multi-spectral data from the designated regions on the image is then condensed using an algorithm to create class signatures. The term “supervised classification” refers to this approach.
- Unsupervised Classification: In the unsupervised instance, an algorithm is applied to the image first, resulting in the formation of some spectral classifications (also known as clusters). Unsupervised classification is the term for this procedure.
Process of Supervised and Unsupervised Classifications :
- Supervised Classification:
- On the image, the information class is first specified. As though the analyst is overseeing the categorization of a collection of information classes, the analyst’s choice of information classes is based on his or her experience with the geographical area and understanding of the real surface and cover types present in the image.
- Classes in information are referred to as “raining areas”. The computer is trained to distinguish spectrally comparable regions for each class using the DN values of all the spectral bands that make up the information class.
- The computer uses algorithms to determine the “class signatures” of each “training area”
- The computer then digitally labels each pixel in the image to the class that it most resembles by comparing it to these spectral signatures.
- Unsupervised Classification:
- In general, it turns the supervised classification process on its head. Information classes are matched to spectral classes once they have been first grouped based on DN values.
- The algorithm analyzes the pixels and groups them into several spectral classes in it (clustering algorithm).
- Number of groups or clusters to be looked in the data is decided by the analyst.
- The analyst can also set parameters for the variance within each cluster and the distance between the clusters.
- Finally the analyst may decide to combine some clusters or breakdown others.
- Unsupervised classification does not start with a predetermined set of classes as in supervised classification.
b. Give the classification of curves along with neat sketched of each ?
Ans:
Curves: These are referred to as arcs that are provided between intersecting straights to progressively negotiate a change in direction and have a finite radius.
Necessity: These are necessary due to following reasons :
- By offering curves, one can gradually alter the alignment’s gradient, direction, or orientation.
- Curves are provided so as to get comfort to the passengers.
- Curves are provided so as to get easy turning in case of road and track
Classification of Curves :1: Horizontal Curves: These are the curves provided to negotiate a change in direction. These can be further classified as :
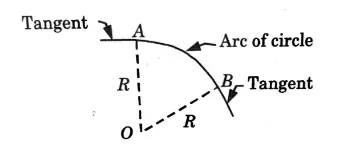
Simple Circular Curve: A single circle arc makes up a straightforward circular curve. It is tangential to both of the route’s straight lines, as depicted in Fig.
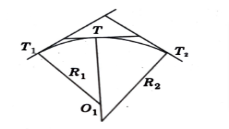
Compound Curve: As seen in Fig., compound curves are formed when two or more simple circular curves of various radii come together at a common tangent point T.
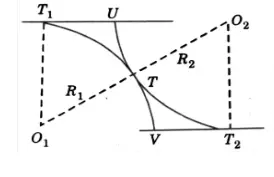
Reverse Curve: Reverse curves, as depicted in Fig., are formed when two straight circular curves with opposite curvature directions merge to produce an S-shaped curve.
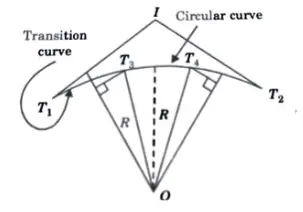
2: Transition Curve: It is a curve that is offered between a straight and a simple circular curve, and whose radius alternates between infinite and finite (equivalent to the radius of the simple circular curve) or vice versa.
3: Combined Curve : A combination of circular curve and transition curve is called a combined curve as shown in Fig
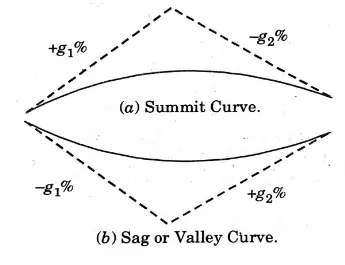
4: Vertical Curve: These are the curves provided to smoothly change one gradient (longitudinal slope) to another. Vertical curves are further of two types
Summit Curve: When a rising gradient meets a dropping gradient, or when the two straights come together to form a peak as in Fig. a, it is provided.
Sag or Valley Curve: Sag curves are formed when two straight lines intersect with a dropping gradient or when a rising gradient, creating a valley or sag. Fig-b.
4.a. Explain Direct Method Contouring ?
Ans: Direct Method of Contouring:
- 1. This approach works well in small spaces where a single central point may control the entire space.
- 2. Theodolite or compass are used to lay out radial lines, and their positions are fixed by horizontal angles and bearings.
- 3. Temporary bench marks are first established at the centre and near the ends of the radial lines.
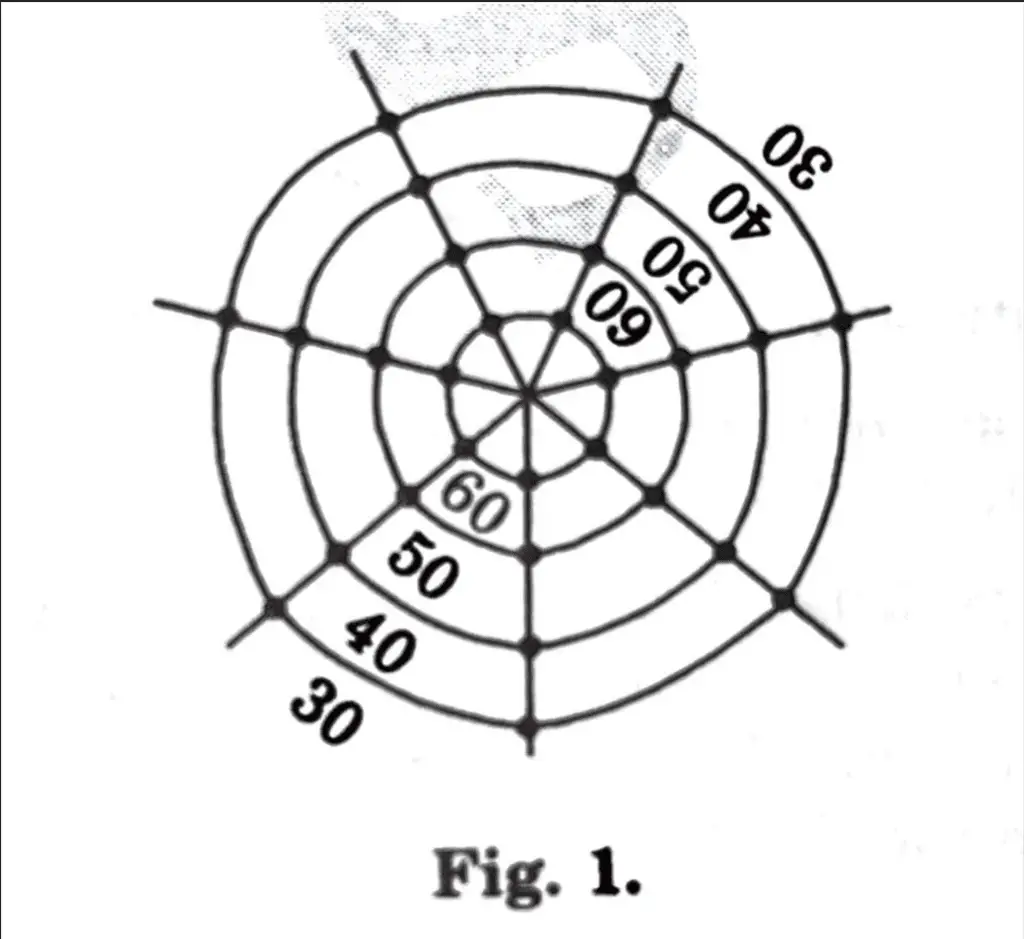
- 4. The contour points are then found, identified, and their positions are calculated by calculating the distances between them along the radial lines.
- 5. They are then plotted on the plan, and the contours drawn by joining all the corresponding points as shown in Fig. 1.
4b What do you understand by GPS? Explain the different sources of errors in GPS.
Ans: GPS:
- The GPS is a space-based, all-weather radio navigation system that can swiftly, precisely, and affordably determine an object’s time, position, and velocity at any given moment, anywhere on the planet.
- The present GPS system is based on precise timekeeping and ephemeris data on each satellite’s current location.
- It generates distances in order to triangulate placements anywhere on earth using satellite signals, precise time, and advanced algorithms.
- Users with the necessary receiving equipment can access the system’s exact, continuous, three-dimensional position and velocity data from anywhere in the world.
- The global positioning system is comprised of three segments:
- Satellite constellation called space segment.
- Ground control/monitoring network called operational control segment. in.
- User receiving equipment called user equipment segment.
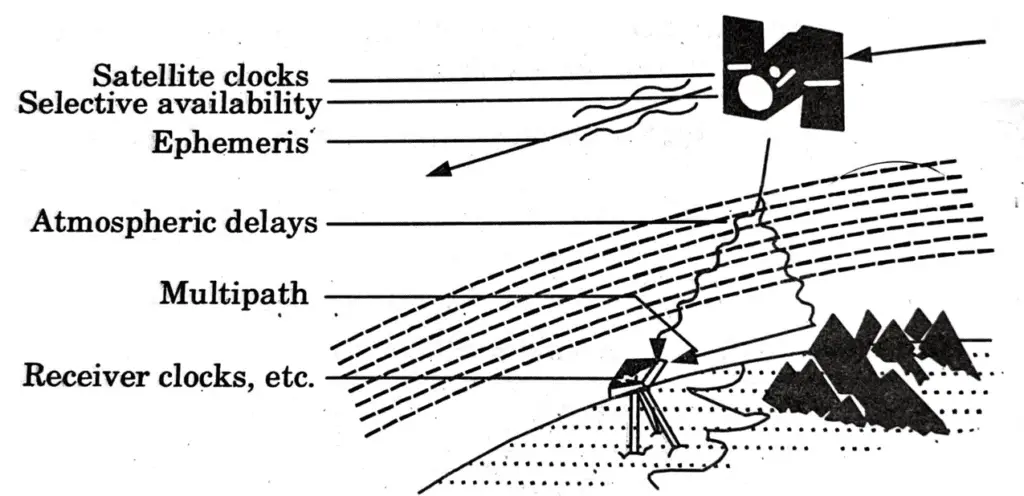
Sources of Error:
- Atmospheric Conditions Error :
- Speed of GPS signal is affected by ionosphere and troposphere.
- It causes a deviation of 0 to 30 m from the actual position of receiver.
- Ephemeris Error:
- The predicted changes in the orbit of a satellite.
- It causes a deviation of 0 to 5 m from the actual position of receiver.
- Clock Drift Error:
- Due to different code generations in satellite and receiver simultaneously.
- It causes a deviation of 0 to 1.5 m from the actual position of receiver.
- Multipath Error:
- Bouncing of GPS signal due to a reflecting surface before reaching to receiver antenna.
- It causes a deviation of 0 to 1 m from the actual position of receiver.
Error Minimization:
- Using a differential GPS reference station will help reduce localised GPS inaccuracies. The satellite clock errors, atmospheric errors, and satellite ephemeris errors are the errors that differential GPS can fix (ionosphere and troposphere errors).
- Minimize of Multipath Error:
- To reduce multipath errors, a number of strategies have been devised, most notably tight correlator spacing.
- For long delay multipath, the receiver itself can recognize the wayward signal and discard it.
- Specialized antennas (such as a choke ring antenna) may be used to lower the signal power when it is received by the antenna in order to address shorter latency multipath from the signal bouncing off the ground.
- Minimize of Ephemeris and Clock Errors : The simultaneous use of two or more receivers at various survey places, known as differential GPS, can minimise these effects for extremely precise positioning (such as in geodesy).
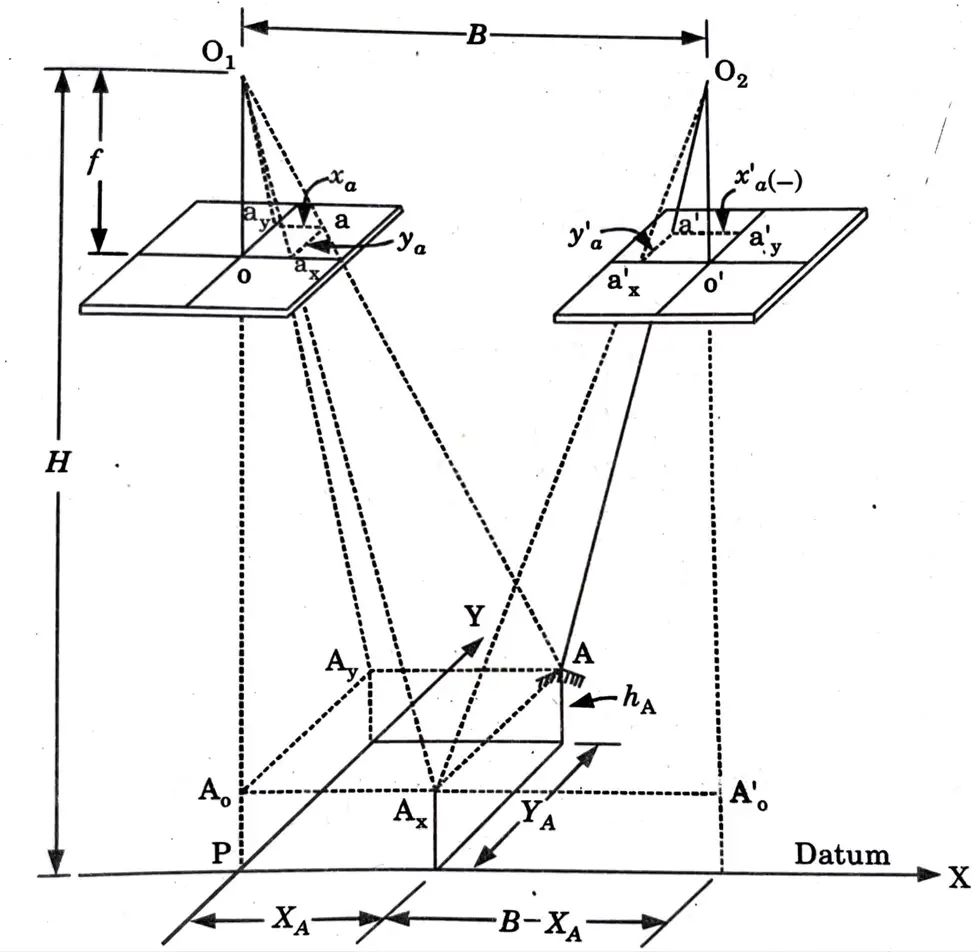
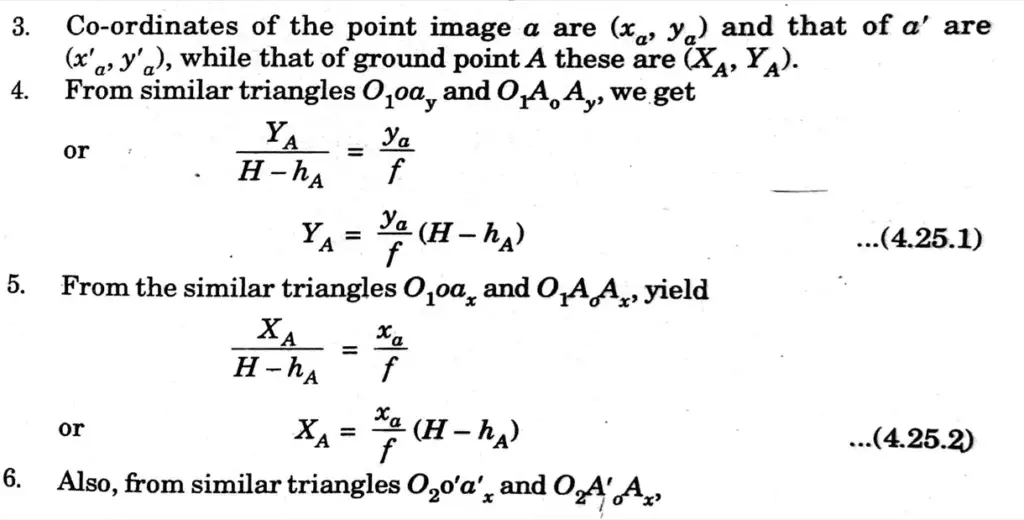
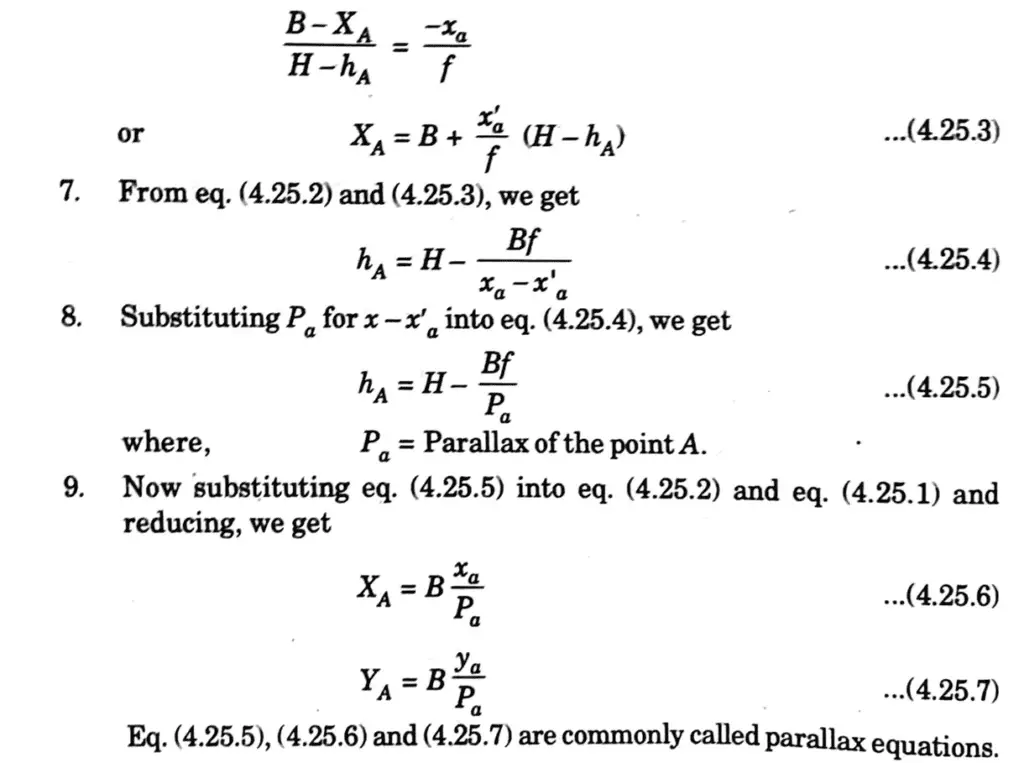
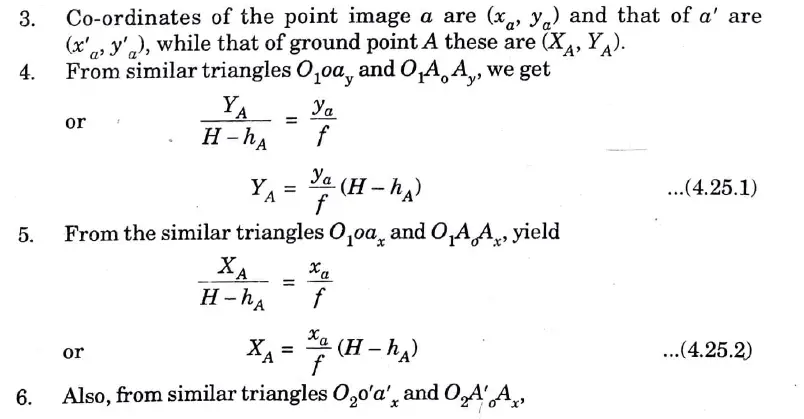
5a. Derive parallax equations for determining elevation and ground coordinates of a point.
Ans:
- Fig.1 shows the two images of a point A as a when the aircraft is at position O1 and as a’ when the aircraft is at 02.
- The fact that image an is to the right of the principal point and image a’ is to the left of the principal point indicates that the image has clearly shifted.
5b b. Explain briefly how GPS works to determine the position coordinates of a point.
Ans:
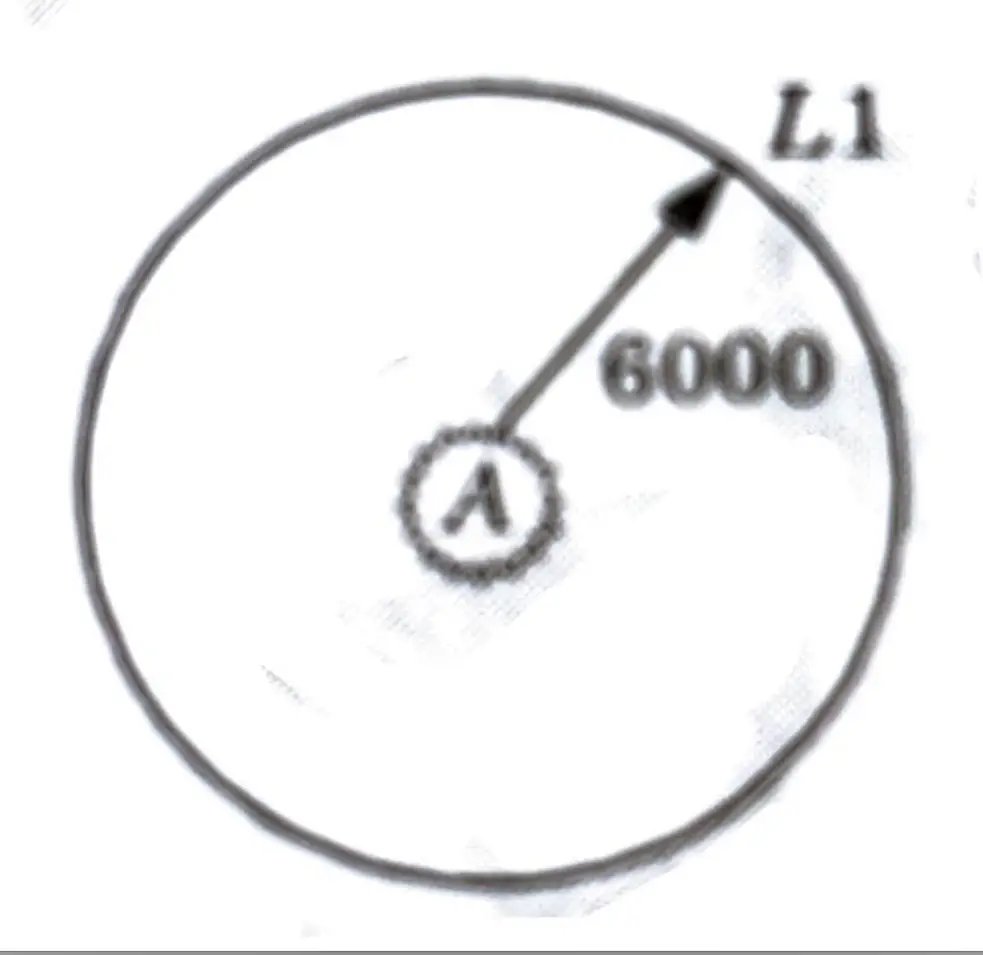
- With the use of more than two satellites—three are the bare minimum needed to obtain an accurate reading of an object’s position—it is the simplest way to locate any point or location on the surface of the globe. Therefore, it is known as the triangulation method.
- By using the example of locating a “location on the surface of the planet” with the aid of more than two satellites, let’s clarify the idea.
- Let us assume that Location of point L1 is 5000 kms from the satellite A. i.e., L1 would be somewhere on the radius of the satellite
- A; 6000 km away from the center (Fig).
- Let us image that the above point i.e., L1 is away from another satellite B by 9000 km (and 6000 km from satellite A).
- Now due to getting the help from two satellites at a time the position of L1 has been narrowed down to the intersection circle of two spheres of satellite A and satellite B; it has been represented by the X Y plane in the Fig..
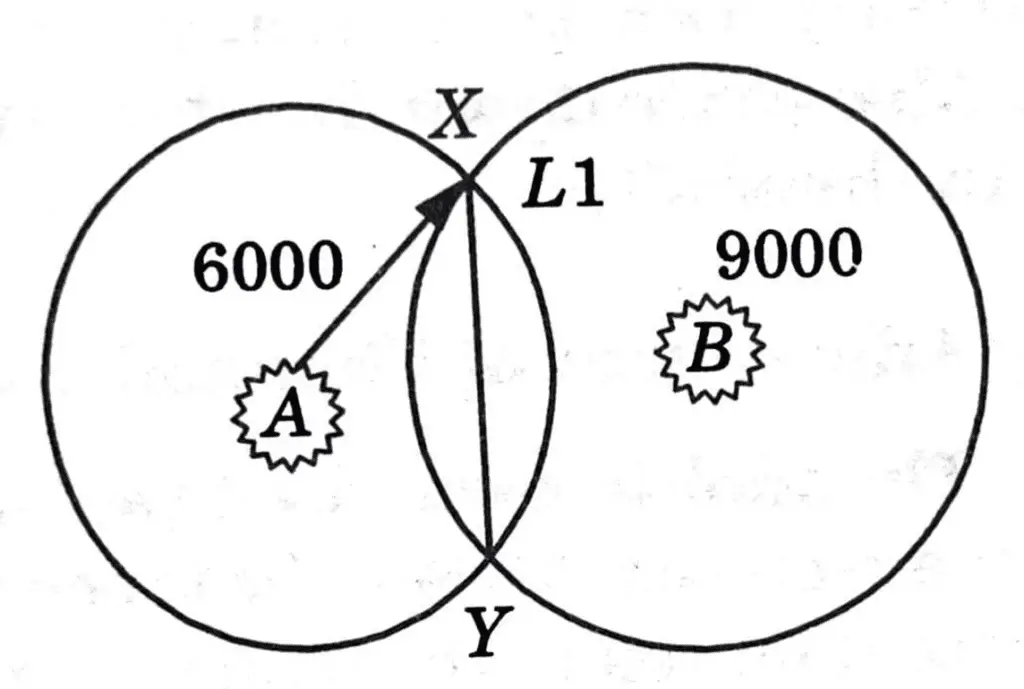
- Fig. 3. Positioning of a point by two satellites.
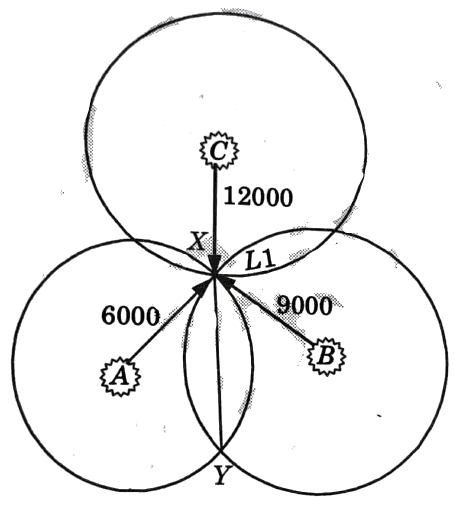
- Finally let us measure the location of L1 by using the distance from the 3rd satellite i.e., satellite C. This is 12000 km.
- If the figures were drawn in three dimensions, the three spheres would now intersect in two places, and the location of L1 could be at either of these two locations. However, because all three of these figures are drawn in two dimensions, there is only one single point e that would serve as the location of L1.
- If the fourth satellite is used to identify the point L1, geometrically it would provide the most exact location of the point L1. However, it may not be true (since it is one of the two expected locations on the three-dimensional plane).
6b: Explain briefly the temporary adjustments made in theodolite. Also write down the steps involved in method of repetition in theodolite.
Ans:
A. Temporary Adjustment of Theodolite:
1. Setting the Theodolite over the Station: The needed station is covered by the tripod stand, after which the theodolite is raised from the box and secured to the top of the stand using a wing nut or in accordance with the mounting method supplied with the instrument.
2. Approximate Leveling by Tripod Stand :
- The tripod stand’s legs are firmly fastened to the ground and spaced far apart. Then, utilizing this platform, a rough levelling is performed.
- To do this, the third leg is moved in or out, clockwise or anticlockwise, so that the bubble is roughly in the middle of its run. Two legs are kept firmly planted on the ground.
3. Centering:
- Centering is the process of setting the instrument exactly over a station.
- It is important to make sure that the plumb bob attached from the hook beneath the vertical axis lies roughly over the station peg when the tripod stand is being used to level the object roughly.
- The centering is then done precisely with the aid of the shifting head (movable capstan nut) so that the plumb bob is precisely over the station peg’s nail.
4. Levelling:
- All foot screws are brought to the centre of their runs prior to beginning the levelling procedure.
- Then the following procedure is adopted :
- Any pair of foot screws are set parallel to the plate bubble (say the first and second foot screws). The bubble can be centred by evenly rotating both of these screws in or out.
- The line connecting the first and second foot screws is perpendicular to the plate bubble after it has been rotated 90 degrees. The bubble is then brought to the centre as indicated in Fig. 2 by rotating the third foot screw either clockwise or anticlockwise.
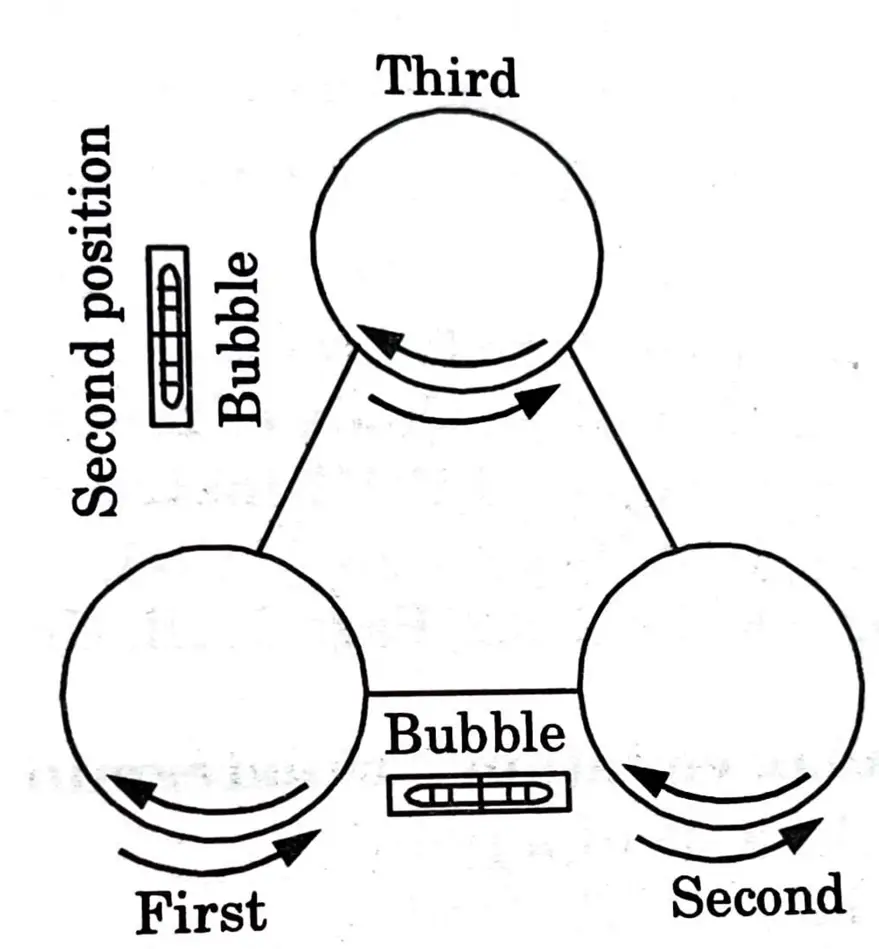
- In order to keep the bubble in the centre of the plate bubble with both directions perpendicular, the process is repeated numerous times.
- The device is rotated 360 degrees around its vertical axis. If the bubble is still in the centre, the adjustment was successful, and the vertical axis is indeed vertical.
5. Focusing the Eye-piece:
- The eye-piece is focused so that the cross-hairs can be seen clearly.
- To accomplish this, point the telescope at the sky or hold a piece of white paper in front of the object glass. Then, adjust the eyepiece by twisting the eyepiece clockwise or anticlockwise until the crosshairs are distinct and sharp.
6. Focusing the Object Glass :
- This is done to remove parallax and bring a sharp image of the object or target into the plane of the crosshairs.
- The focusing screw is cranked clockwise or anticlockwise until the image appears clear and sharp and there is no relative movement between the image and crosshairs. The telescope is then pointed at the object or target.
- The absence of relative movement can be verified by moving the
eye up and down.
7. Setting the Vernier:
- The vernier A is set to 0° and vernier B to 180°.
- To do this, the lower clamp is fixed. The upper clamp is loosened and the upper plate turned until the arrow of vernier A approximately coincides with zero (i.e., the 360° mark) and that of vernier B approximately coincides with the 180° mark.
- The arrows are then brought to an exact coincidence position by rotating the upper tangent screw once the upper clamp has been tightened.
B. Method of Repetition:
- By using the repetition approach, you may measure an angle, like ABC, by positioning an instrument at B and levelling it. The telescope ought to be set up normally.
- When the index (the arrow) of the vernier A coincides with the zero (or 360°) of the horizontal circle, loosen the upper clamp and rotate the upper plate.
- Utilizing the upper clamp, secure both plates. The two zeros must absolutely line up as you turn the upper slow motion (tangent) screw.
- Tighten the lower clamp and bisect station A exactly by the lower tangent screw. Read both the verniers.
- Unclamp the upper plate and swing the telescope clockwise. Bisect station C by the upper clamp and tangent screw.
- Read both the verniers. Take the average to get angle ABC.
- Unclamp the lower plate and swing the telescope clockwise and bisect station A accurately by using the lower clamp and lower tangent screw.
- Read both the verniers. Check the vernier reading. It should be the same (unchanged) as that obtained in step 6.
- Utilizing the upper clamp, tangent screw, and precisely bisecting station C, release the upper plate (the telescope is turned clockwise). The vernier will display ABC twice.
- Repeat the process for required number of times, say three times, and find out the value of angle ABC.
- Calculate the angle ABC by repeating the process above with a different face.
- The average of the two values of angle ABC thus obtained with face left and face right gives a precise value of the horizontal angle.
7a. Describe the different methods of measuring distance and state the various types of EDM instruments.
Ans:
EDM:
- A surveying tool used to measure distance electronically between two sites using electromagnetic waves is an electronic distance measurement device.
- Phase changes that take place as electromagnetic energy waves go from one end of the line to the other are used in electronic distance measuring (EDM) to calculate the distance between two sites.
Measuring Method: Following are three methods of measuring distance between two points:
- DDM or Direct Distance Measurement: This is mainly done by chaining or taping.
- ODM or Optical Distance Measurement: Tacheometry, the horizontal subtense technique, or telemetry are used to take this measurement. With the aid of optical wedge attachments, these are completed.
- EDM or Electromagnetic Distance Measurement: In rough terrains, the direct distance measurement method cannot be used.
- This strategy should not be used when the landscape is unevenly vast or there are substantial impediments.
Types of EDM Instruments: Depending upon the type of carrier wave employed, EDM instruments can be classified under the following heads:
Microwave Instruments:
- These instruments are under the category of long range instruments, which allow for distance measurements up to a range of 100 km using carrier frequencies in the 3 to 30 GHz (1 GHz = 109) range. This group includes the tellurometer.
- Phase comparison technique is used for distance measurement.
- The master instrument installed at the measuring end and this remote instrument are the same thing.
Visible Light Instruments:
- These instruments use visible light as carrier wave, with a higher frequency, of the order of 5 × 10¹⁴ Hz.
- These EDM instruments have a shorter range than microwave devices because the transmitting strength of a carrier wave at such a high frequency rapidly decreases with distance.
- A geodimeter comes under this category of EDM instruments.
- In order to prevent signal loss, the carrier, which is sent as a light beam, is focused on a signal using a lens or mirror system.
Infrared Instruments:
- The near infrared radiation band, with a wavelength of around 0.9 um, is easily created by gallium arsenide (Ga As) infrared emitting diodes and is used by the EDM equipment in this category.
- At high frequencies, it is quite simple to directly amplitude modulate these diodes. This modulated carrier wave was produced using a cheap technique.
- Due to the reason, there is predominance of infrared instruments in EDM.
- Wild Distomats fall under this category of EDM instruments.
7b. Derive parallax equation for determining elevation and ground coordinates of a point.
Ans.1. Fig. 4.25.1 shows the two images of a point A as a when the aircraft is at position O1 and as a’ when the aircraft is at O2.
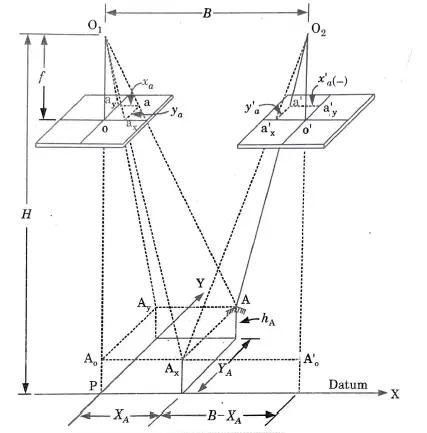
2. There is obviously a shift in the image because the image a is to the right
of principal point whereas the image a’ is to the left of principal point.
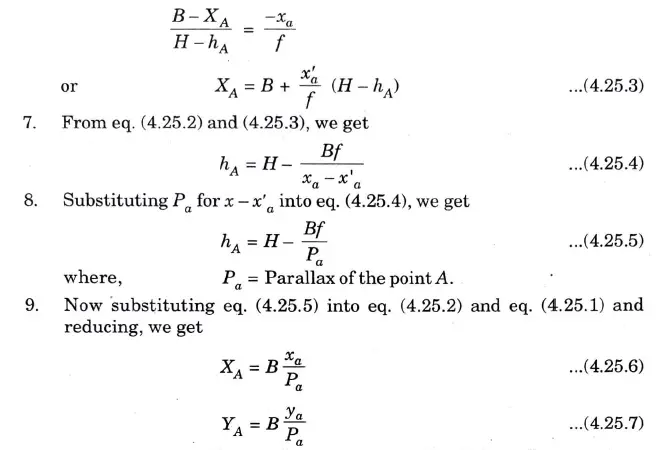
Eq. (4.25.5), (4.25.6) and (4.25.7) are commonly called parallax equations.

Surveying And Geomatics Quantum, Syllabus, Important Questions
| Label | Link |
|---|---|
| Subject Syllabus | Syllabus |
| Short Questions | Short-question |
| Important Unit-1 | Unit-1 |
| Important Unit-2 | Unit-2 |
| Important Unit-3 | Unit-3 |
| Important Unit-4 | Unit-4 |
| Important Unit-5 | Unit-5 |
| Question paper – 2021-22 | 2021-22 |
Surveying And Geomatics Quantum PDF: | AKTU Quantum PDF:
| Quantum Series | Links |
| Quantum -2022-23 | 2022-23 |
AKTU Important Links | Btech Syllabus
| Link Name | Links |
|---|---|
| Btech AKTU Circulars | Links |
| Btech AKTU Syllabus | Links |
| Btech AKTU Student Dashboard | Student Dashboard |
| AKTU RESULT (One VIew) | Student Result |