
With Aktu’s Quantum Notes, you can succeed in B.Tech. These important notes, which include important and recurrent questions, will help you explore the world of computer graphics. Making A+ grades in tests simple! Unit-4 Curves and Surfaces
Dudes 🤔.. You want more useful details regarding this subject. Please keep in mind this as well.

Important Questions For Computer Graphics:
*Quantum               *B.tech-Syllabus
*Circulars                *B.tech AKTU RESULT
* Btech 3rd Year    * Aktu Solved Question Paper
Q1. What are the parametric continuity conditions in a spline representation ?
Ans. We imposed various continuity conditions at the connection points to ensure smooth transition from one section to the next section of the piecewise parametric curve. If the spline curve is described in terms of parametric coordinate form like
Spline curve can be represented as:
1. Zero-order parametric continuity: When two pieces of the curve meet at a point, this is known as zero-order parametric continuity as shown in Fig. and is represented by C0.

The values of x,y, z can be evaluated at v, for the first piece of curve and will be equal to the values of x, y, z evaluated at v, for the second curve.
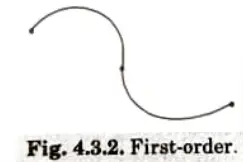
2. First-order parametric continuity: The first-order parametric continuity shows that the first derivatives of the coordinate function x = x (v), y = y(v), z = z(v) for two successive pieces are equal at their Joining point as shown in Fig. This is represented by C1.
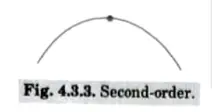
3. Second-order parametric continuity: The second-order parametric continuity shows that both the first and second-order derivatives of the two curve pieces are the same at intersection as shown in Fig. This is represented by C2.
Q2. Explain the characteristics of B-spline curve. How is it useful for interpolation ?
Ans. Characteristics of B-spline curve:
- 1. For any parameter value, the sum of the B-spline basis functions equals 1.
- 2. For all parameter values, each basis function is positive or zero,
- 3. Every basis function, with the exception of k=1, has exactly one maximum value.
- 4. The number of vertices in the defining polygon equals the maximum order of the curve.
- 5. The degree of the B-spline polynomial is independent of the defining polygon’s number of vertices.
- 6. The curve demonstrates the declining variation feature.
- 7. Typically, the curve takes the form of the defining polygon.
B-spline curve is useful for interpolation because:
- 1. The degree of the B-spline polynomial is independent of the quantity of defining polygon control points.
- 2. Because each control point influences a curve’s shape only within a range of parameter values where its associated basis function is non-zero, B-splines enable local control over the curve surface.
Q3. Write note on interpolation.
Ans.
- 1. A method of creating new data points within the range of a discrete set of existing data points is interpolation.
- 2. A function’s values for a small range of independent variable values are represented by the number of data points gathered through sampling or experimenting.
- 3. Interpolation, or estimating the value of that function for an intermediate value of the independent variable, is frequently necessary.
- 4. A simpler function that is still somewhat close to the original can be created by interpolating a few data points from the original function. The cost from interpolation mistake could be outweighed by the gain in simplicity that results.
- 5. Finding the appropriate mathematical equation for the established curve is the primary objective in this procedure.
- 6. When we need to build a curve by choosing intermediate points between the known sample points, we utilise the interpolation technique.
Q4. Explain the types of interpolation method.
Ans. Type of interpolation methods are:
- 1. IDW:
- a. A method of interpolation called inverse distance weighting (IDW) is used by the IDW tool to estimate cell values by averaging the values of sample data points in the vicinity of each processing cell.
- b. A point’s influence or weight on the average calculation increases with proximity to the estimated cell’s centre.
- c. The output value of each site can be calculated using either a predetermined set of points or all the points within a predetermined radius.
- 2. Kriging:
- a. Kriging is a geostatistical method for estimating values in unknown areas that takes into account both the distance and the amount of variation between known data points.
- b. With the help of a dispersed collection of points and z-values, this approach creates an approximated surface.
- c. Before choosing the optimum estimating technique to produce the output surface, it should be completed.
- 3. Natural neighbour:
- a. The nearest subset of input samples to a query point are found using natural neighbour interpolation, which then applies weights to those samples based on proportionate areas to interpolate a value.
- b. Sibson or “area-stealing” interpolation is another name for it.
- 4. Spline: The spline tool employs an interpolation technique that creates a smooth surface that precisely passes through the input points by estimating values using a mathematical function that reduces overall surface curvature.
- 5. Spline with barriers: The main distinction between the spline with barriers tool and the spline tool is that this tool honours discontinuities recorded in both the input point data and the input barriers.
- 6. Topo to raster: With the input contour data, a surface that more closely resembles a natural drainage surface and better retains stream networks is produced using an interpolation technique.
- 7. Trend:
- a. A global polynomial interpolation called “trend” fits the input sample points to a smooth surface that is determined by a mathematical function (a polynomial).
- b. The data’s coarse-scale patterns are captured by the trend surface, which evolves gradually.
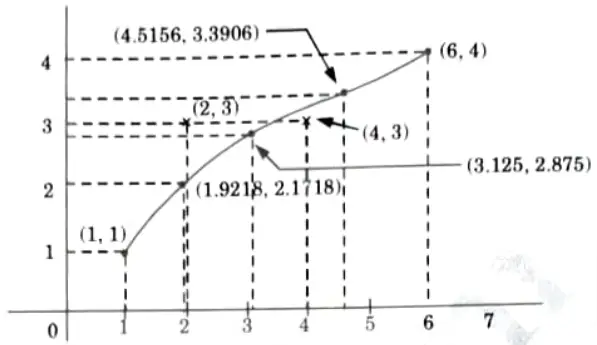
Q5. Construct the Bezier curve of order 3 with 4 polygon vertices A(1, 1), B(2, 3), C4, 3), D(6, 4).
Ans. The equation for the Bezier curve is given as:
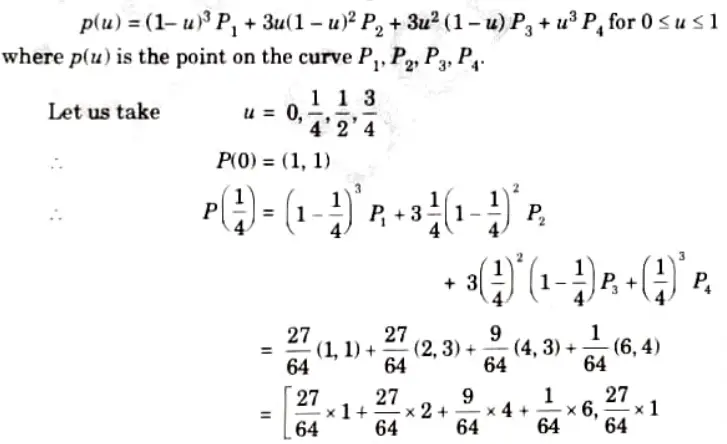
Fig. shows the calculated points of the Bezier curve and curve passing through it.
Q6. Construct enough points on the Bezier curve whose control points are p0(4, 2), p1(8, 8) and p2(16, 4) to draw an accurate sketch.
1. What is the degree of the curve ?
2. What are coordinates at u = 0.5.
Ans. 1. Here n = 2 i.e., order = 2
Degree = order -1 = 2 – 1 = 1
2. Blending function of the curve :
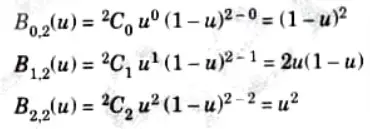
then Bezier curve for given control points:
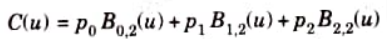
Bezier curve in x and y coordinate is given as :
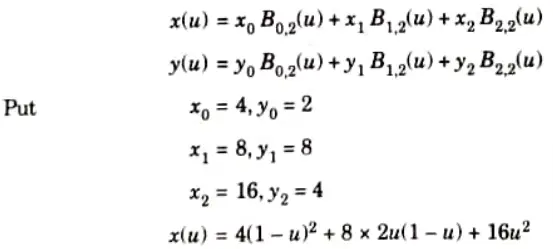
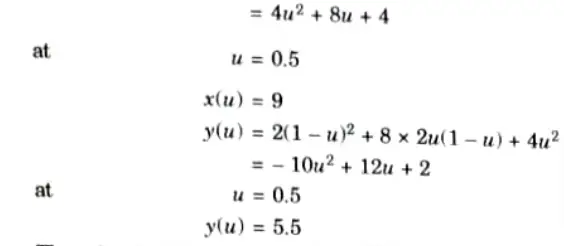
Therefore, the coordinates at u = 0.5 are (9, 5.5).

Computer Graphics Btech Quantum PDF, Syllabus, Important Questions
| Label | Link |
|---|---|
| Subject Syllabus | Syllabus |
| Short Questions | Short-question |
| Question paper – 2021-22 | 2021-22 |
Computer Graphics Quantum PDF | AKTU Quantum PDF:
| Quantum Series | Links |
| Quantum -2022-23 | 2022-23 |
AKTU Important Links | Btech Syllabus
| Link Name | Links |
|---|---|
| Btech AKTU Circulars | Links |
| Btech AKTU Syllabus | Links |
| Btech AKTU Student Dashboard | Student Dashboard |
| AKTU RESULT (One VIew) | Student Result |