
Master Control Systems using Aktu’s Quantum Notes. Access critical insights and frequently asked questions to excel in your B.Tech courses. Your journey to success begins here! Unit-4 Frequency Response Analysis
Dudes 🤔.. You want more useful details regarding this subject. Please keep in mind this as well.

Important Questions For Control System:
*Quantum               *B.tech-Syllabus
*Circulars                *B.tech AKTU RESULT
* Btech 3rd Year    * Aktu Solved Question Paper
Q1. What do you understand by frequency response ? What are its various methods ? Discuss their advantages, disadvantages and limitations.
Ans. A. Frequency response:
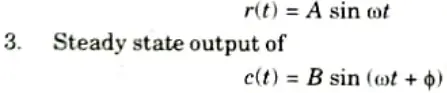
- 1. The frequency response is the magnitude and phase relationship between a system’s sinusoidal input and steady-state output.
- 2. Linear system with sinusoidal input
B. Various methods of frequency response:
1. Polar plots 2. Inverse polar plots
3. Nyquist stability criterion 4. Bode plot
C. Advantages of frequency domain approach:
- 1. The frequency response of a stable open loop system can be obtained experimentally without knowing the transfer function.
- 2. These methods are simple to apply for control design and determining absolute and relative system stability.
- 3. Even with substantial nonlinearity, the system can be represented by an approximation transfer function.
- 4. There is a close relationship between a system’s frequency response and its step response.
D. Disadvantages of frequency response:
- 1. The frequency test is difficult to perform for systems with very large time constants because the time necessary for the output to achieve steady-state for each frequency of the test signal is disproportionately long.
- 2. Non-interruptible systems cannot be subjected to the frequency response test.
E. Limitations of frequency response methods :
- 1. These methods can be applied only to linear systems.
- 2. For an existing system, obtaining frequency response is possible only if the time constants are up to few minutes.
- 3. Obtaining frequency response practically is fairly time consuming.
Q2. Sketch the polar plot of the following function, also determine Gain Margin, Phase Margin, H(s) = 1
Ans.
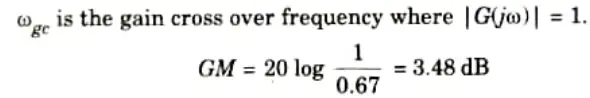
10. As GM and PM are positive, system is stable.
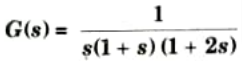
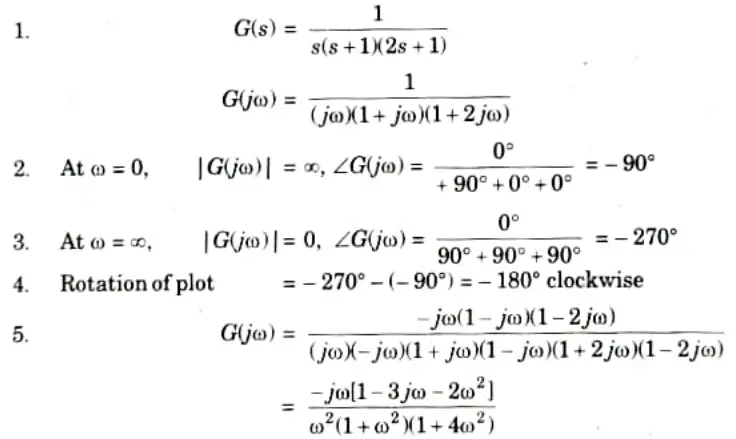
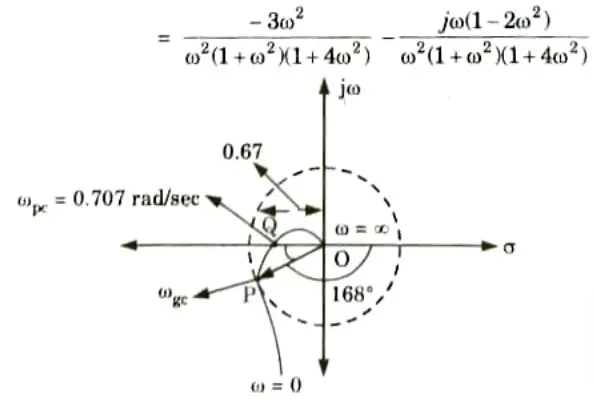
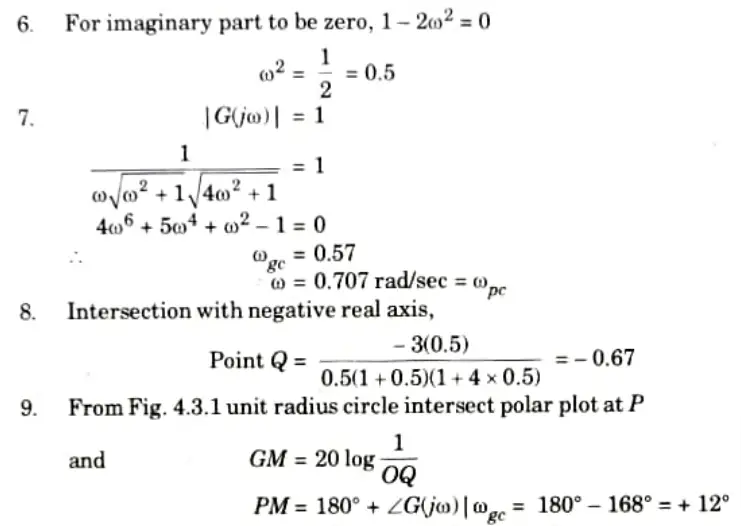
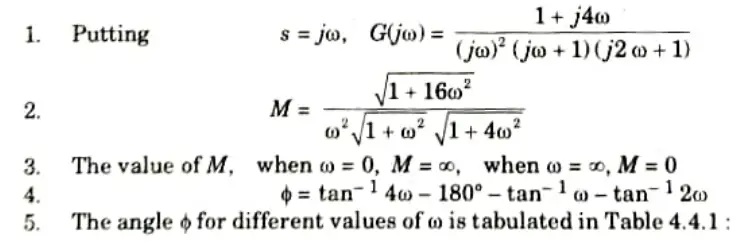
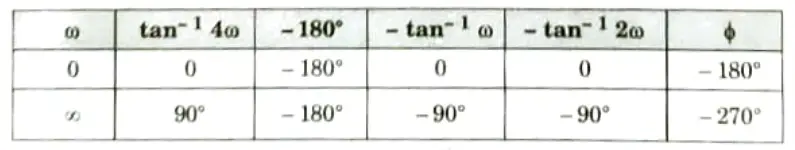
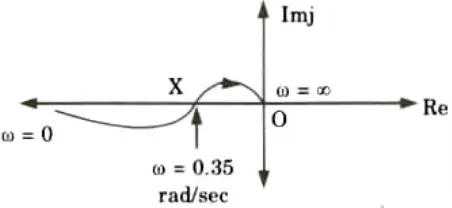
Q3. Sketch the polar plot for the following transfer function
G(s) = (1 + 4s)/s2 (s + 1) (2s + 1)
Ans.
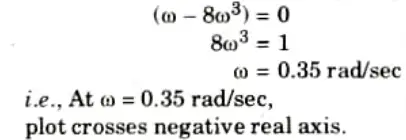
6. Polar plot makes an intercept on the negative real axis at point X.
7. The intercept OX is calculate as given below :
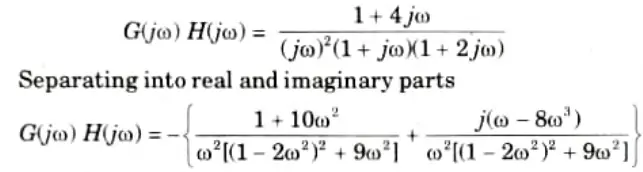
Equating imaginary part to zero
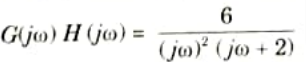
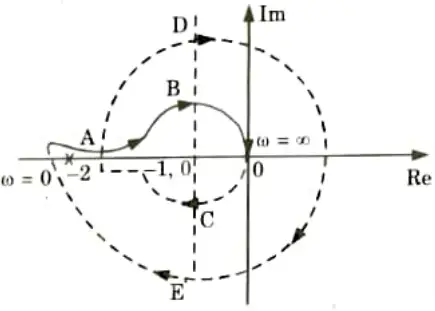
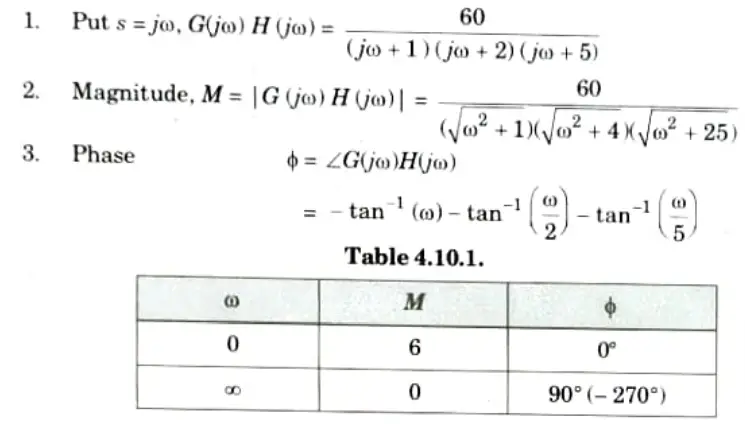
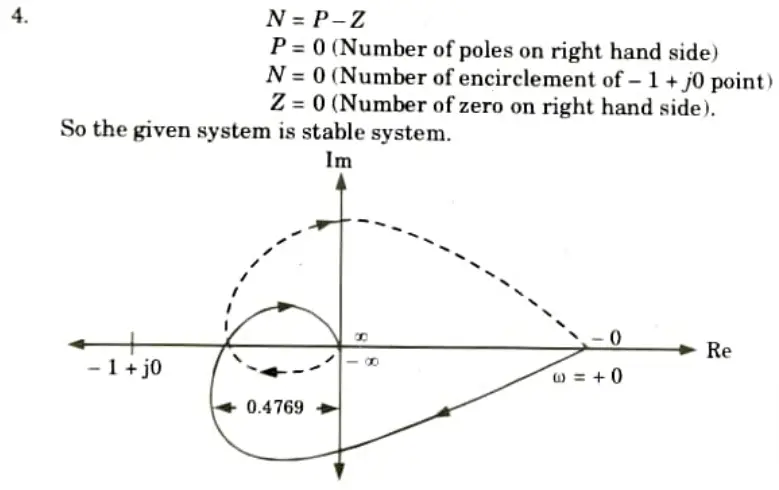
Q4. Sketch Nyquist plot for G(s) H(s) = 6/s2 (s + 2) comment, on stability.
Ans. Given: G(s) H(s) = 6/s2(s +2)
To Sketch: Nyquist plot.
1. In frequency domain the given transfer function will become,
2. Magnitude (M),
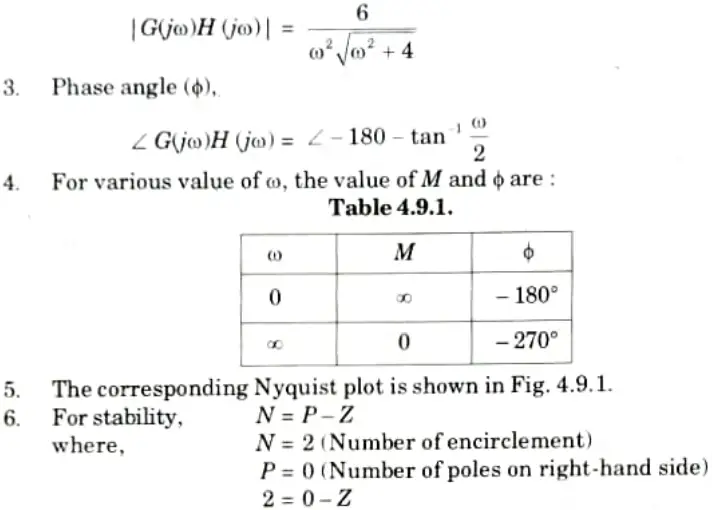
Z= 2 (Number of zeros on right-hand side)
So the system is unstable because its value lies in the right half s-plane.
Q5. Sketch the Nyquist plot for the system with open loop transfer function
and comment on stability.
Ans.
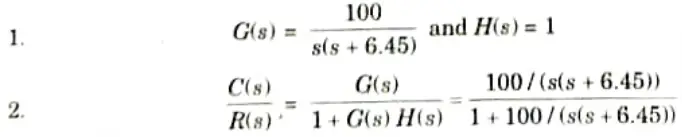
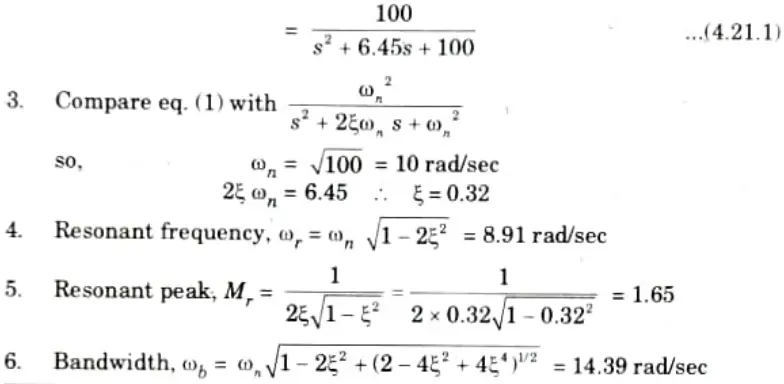
Q6. The forward path transfer function of unity feedback control system is G(s) = 100/s(s + 6.45). Find the resonance peak Mr, resonant frequency ωr, and bandwidth of the closed loop system.
Ans.

Control System Btech Quantum PDF, Syllabus, Important Questions
| Label | Link |
|---|---|
| Subject Syllabus | Syllabus |
| Short Questions | Short-question |
| Question paper – 2021-22 | 2021-22 |
Control System Quantum PDF | AKTU Quantum PDF:
| Quantum Series | Links |
| Quantum -2022-23 | 2022-23 |
AKTU Important Links | Btech Syllabus
| Link Name | Links |
|---|---|
| Btech AKTU Circulars | Links |
| Btech AKTU Syllabus | Links |
| Btech AKTU Student Dashboard | Student Dashboard |
| AKTU RESULT (One VIew) | Student Result |