
Use our AKTU question paper and solution to learn Control System. To better know this important engineering discipline, access thorough notes, pdf.
Dudes 🤔.. You want more useful details regarding this subject. Please keep in mind this as well.

Important Questions For Control System:
*Quantum          *B.tech-Syllabus
*Circulars           *B.tech AKTU RESULT
* Btech 3rd Year
Section A: Control System Short Questions
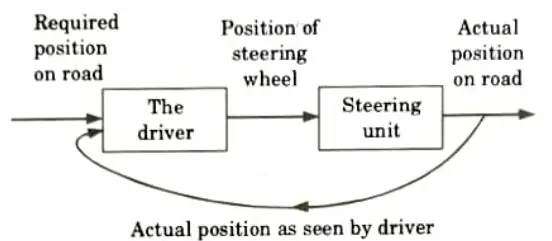
a. Draw the block diagram, which represent a driver driving a car.
Ans.
b. Define: Self loop and non-touching loop in signal flow graph by suitable example.
Ans. 1. Selfloop: A feedback loop consisting of only one node is called self loop. i.e., G33 at x3 is selfloop.
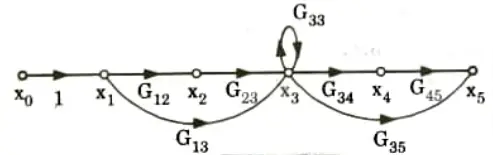
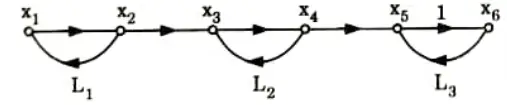
2. Non-touching loops: If there is no node common in between the two or more loops, such loops are said to be non-touching loops.
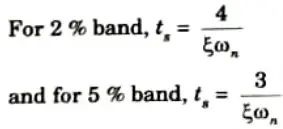
c. What do you mean by settling time, write expression for 2nd order system?
Ans. Settling time is the time required for the response curve to reach and stay within a specified percentage (2% to 5%) of its final value.
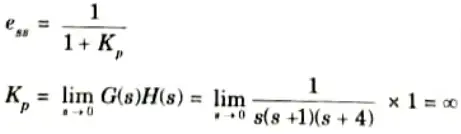
d. The OLTF of a unity feedback system is G(s) = 1/s(s + 1)(s+4) find the steady state error (ess) due to a unit step.
Ans. For unit step input steady state error,
e. What are the limitations of Routh Hurwitz criterion ?
Ans. 1. It is valid only if the characteristics equation is algebraic.
2. If any coefficient of the characteristic equation is complex or contains power then this criterion cannot be applied.
f. State absolute stability and relative stability.
Ans.
- 1. Absolute stability: A system is said to be perfectly stable if the output is constant for all variations in its parameters. It provides information on how stable or unstable the system is.
- 2. Relative stability: On the basis of the settling time, the system is deemed to be relatively more stable or unstable. If the system’s settling time is shorter than that of the competing system, the system is deemed to be substantially more stable. The degree of stability or how close to instability it is is indicated by relative stability.
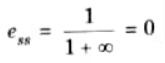
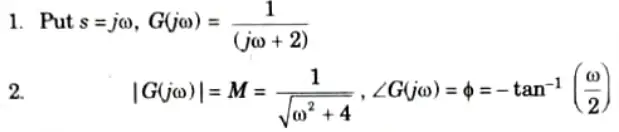
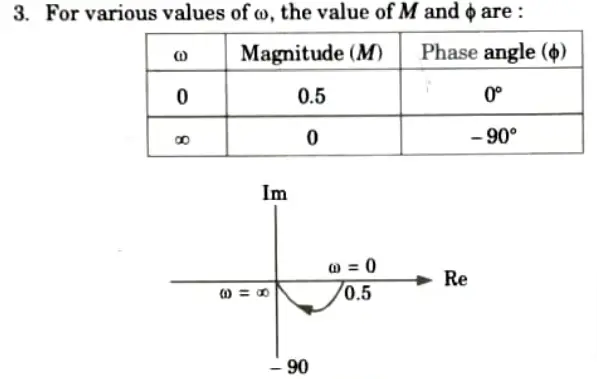
g. Draw the polar plot G(s) = 1/(s +2)
Ans.
h. Write advantages of Bode Plot.
Ans. 1. The magnitudes are expressed in dB, and so, a simple procedure is available to add magnitude to each one by one.
2. The frequency domain specifications can be easily determined.
i. Find the eigen vectors of the matrix
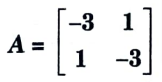
Ans. 1. The characteristics equation for eigen values,
2. Solving characteristic equation,
These are the eigen values of matrix A.
3. To find eigen vectors, obtain matrix [A – 𝛌I] for each eigen value of 𝛌 in eq. (1).
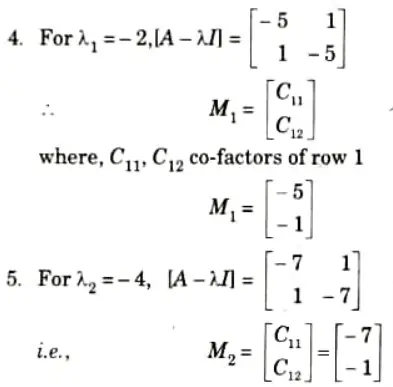
M1 and M2 are the eigen vectors corresponding to the eigen values of 𝛌1 and 𝛌2.
j. Why compensators are used in control system, what is effect of lag compensator ?
Ans. A. Reason:
- 1. Compensate an unstable system to make it stable.
- 2. A compensating network is used to minimize overshoot.
- 3. These compensating networks increase the steady state accuracy of the system.
B. Effect of lag compensators: It functions essentially as a low pass filter since it allows high gain at low frequencies. As a result, it enhances steady state performance.
Section B: Control System Long Questions
a. Write down various rules involve in block diagram reduction method.
Ans. A. Blocks:
- 1. A block diagram of a system is a visual representation of the functions carried out by each component and the signal flow.
- 2. Block diagrams are a common way to represent systems. Even for the intricate system, these are simple to build. The role of each individual part in a system’s block diagram is simple to understand.
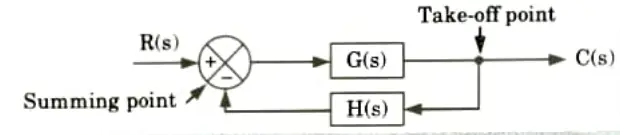
B. Sunming point: The control system’s output is fed back to the point of summarization where it is compared to the reference input.
C. Branch point: A block’s signal can simultaneously travel to other blocks or running points from a point known as a branch point or take off point.
D. Block diagram reduction rules:
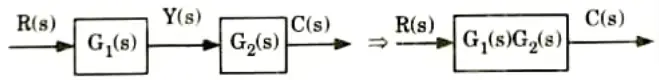
1. Series connection:
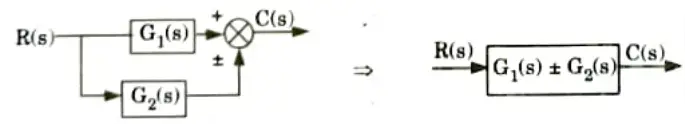
2. Parallel connection:
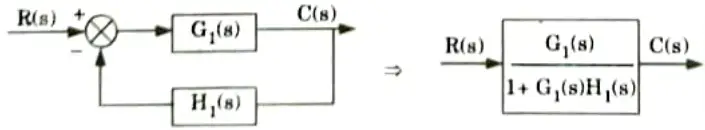
3. Positive feedback connection:
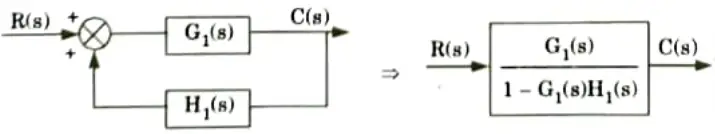
4. Negative feedback connection:
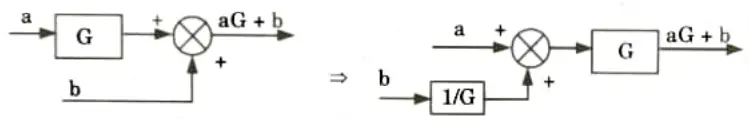
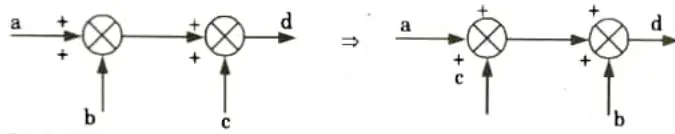
5. Moving the summing point ahead of the block:
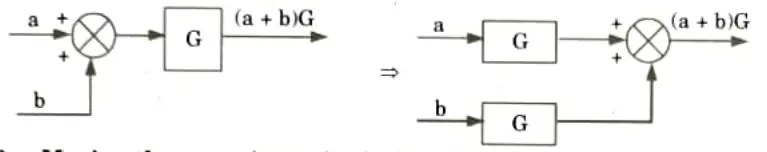
6. Moving the summing point before the block:
7. Interchanging input:
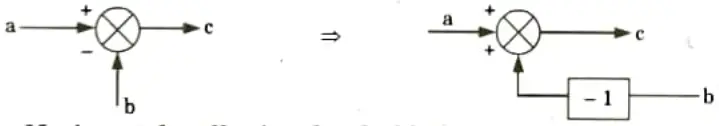
8. Multiplication by (-1) to the input:
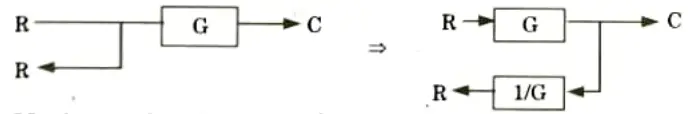
9. Moving a take-off point ahead a block:
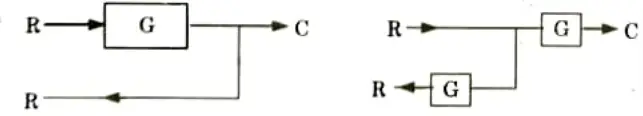
10. Moving a take-off point before a block:
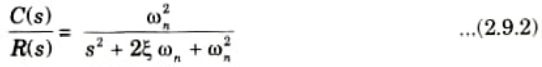
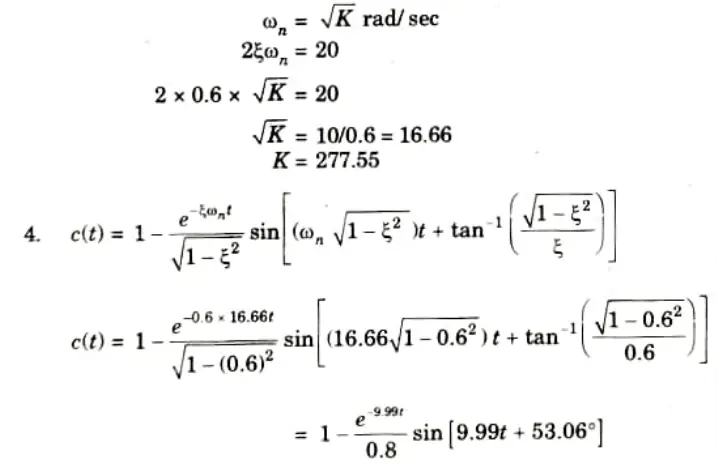
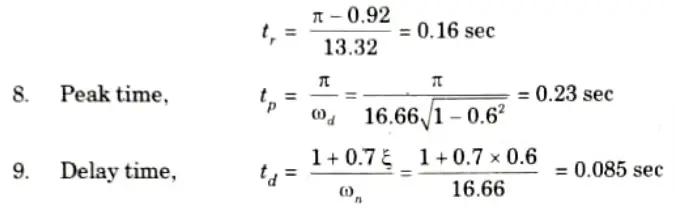
b. The unity feedback system is characterized by an open loop transfer function is G(S) = K/s(s + 20). Determine the gain K, so that the system will have a damping ratio of 0.6. For this value of K, determine unit step response, time domain specifications: settling time (2% criterion), peak overshoot, rise time, peak time, delay time for a unit-step input.
Ans. Given: G(s) = K/s(s + 20), H(s) = 1, 𝛏 = 0.6
To Find: Unit step response, Settling time, Peak overshoot, Rise time, Peak time, Delay time.
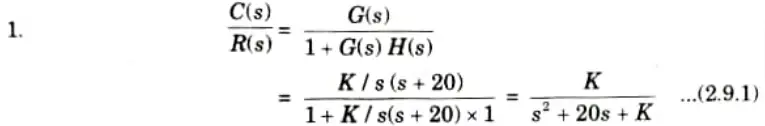
2. For second order system
3. Comparing eq. (2.9.1) and (2.9.2), we get
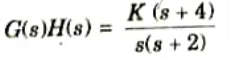
c. Explain the effect of addition of pole and zero on root locus and time domain specifications.
Ans. A. Effects of addition of poles:
- 1. Root locus shifts towards imaginary axis.
- 2. System stability relatively decreases.
- 3. System becomes more oscillatory in nature.
Example:
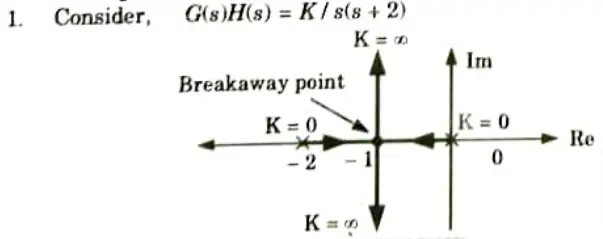
Corresponding root locus is shown in the Fig.
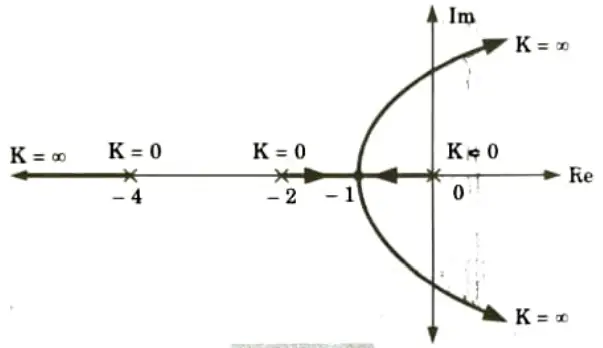
2. Now if pole at s = – 4 added to G(s)H(s) root locus becomes as shown in the Fig.
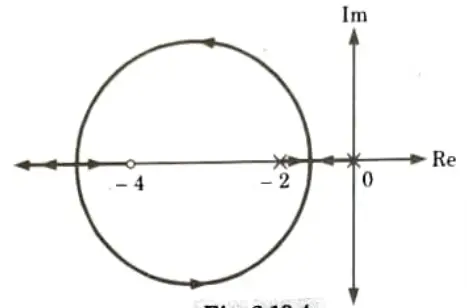
B. Effects of addition of zeros:
- 1. Root locus shifts to left, away from imaginary axis.
- 2. Relative stability of the system increases.
- 3. System becomes less oscillatory.
Example:
2. Now if zero at s = – 4 added to G(s)H(s) root locus becomes as shown in Fig.
3. It can be seen that root locus shift towards left. So as roots move towards left halfords-plane, hence relative stability increases.
C. Time domain specifications:
- 1. Delay tine (td)
- 2. Rise time (tr)
- 3. Peak time (tp)
- 4. Maximum overshoot (Mp)
- 5. Settling time (ts)
d. Sketch the polar plot of the following function, also determine gain margin, phase margin, H(s) = 1
Ans. Given:
To Find: Gain margin and phase margin.
To Sketch: Polar plot.
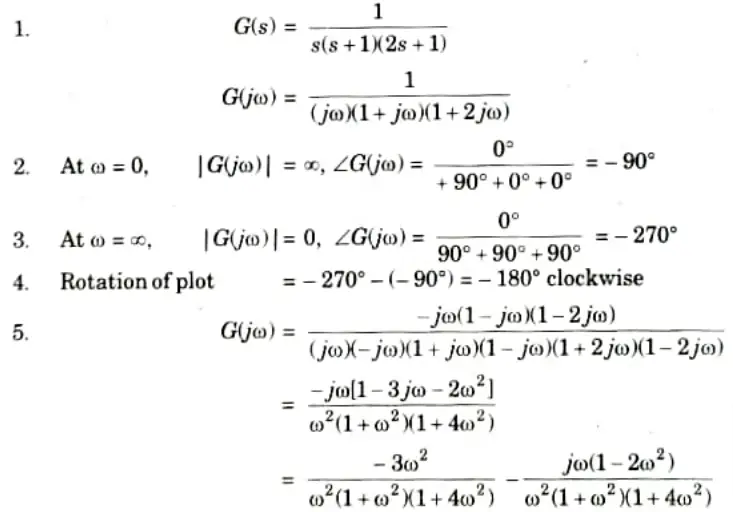
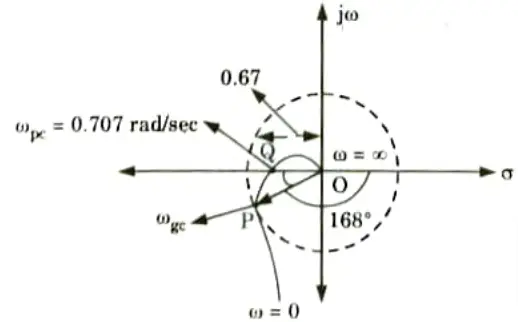
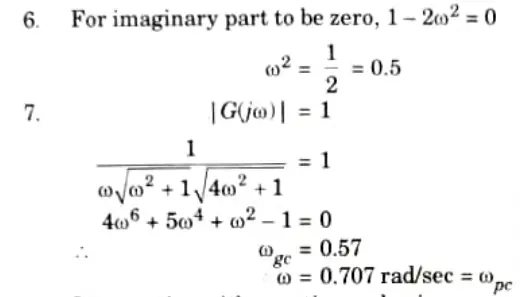
8. Intersection with negative real axis,
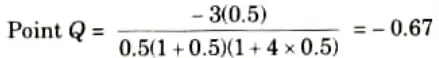
9. From Fig. 4.3.1 unit radius circle intersect polar plot at P
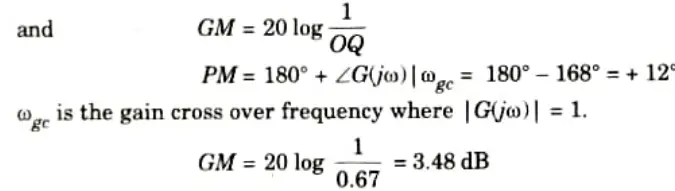
10. As GM and PM are positive, system is stable.
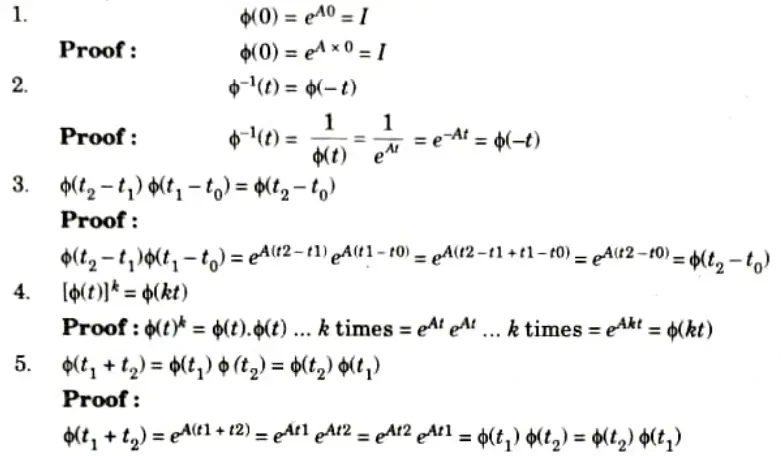
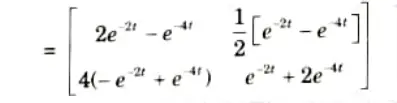
e. State properties of State Transition Matrix (STM), find out state transition matrix for

Ans. A. Properties of state transition matrix: The matrix 𝛟(t) = exp (At) is an n x n matrix and it helps in transition from initial state X(0) to any other state x(t) for t > 0, hence 𝛟(t) is called state transition matrix.
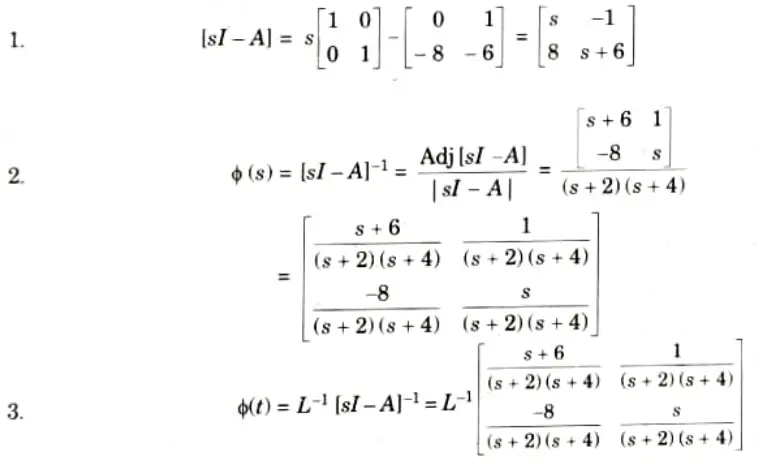
B. Numerical:
Given:
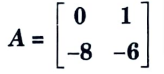
To Find: 𝛟(t)
Section 3: Block Diagram Reduction Method
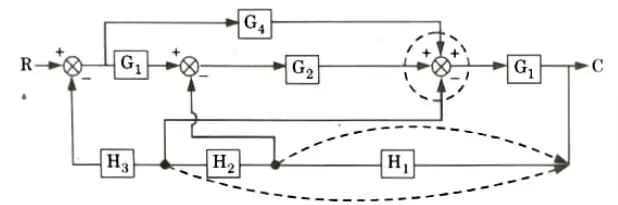
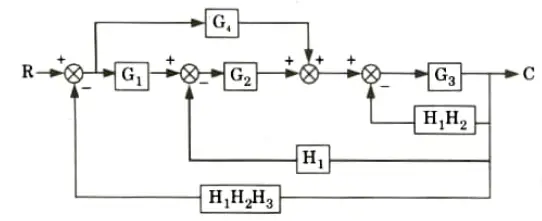
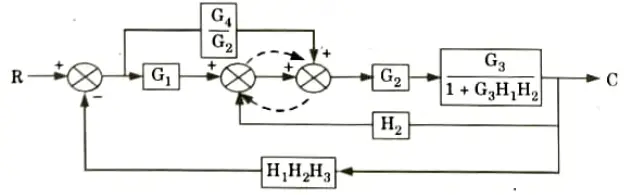
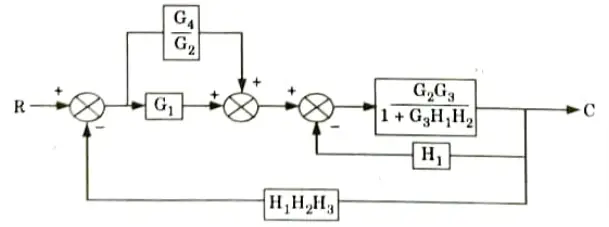
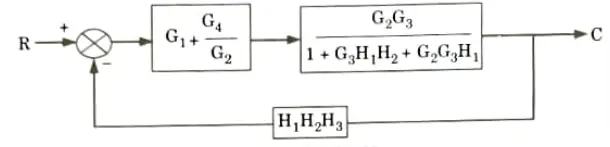
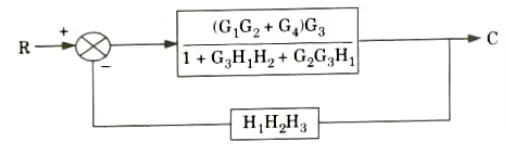
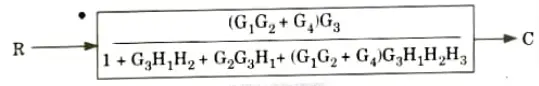
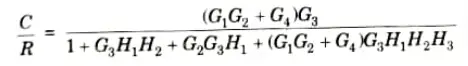
a. Find out C/R by using block diagram reduction method.
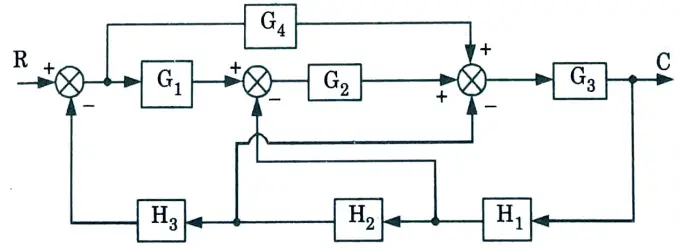
Ans.
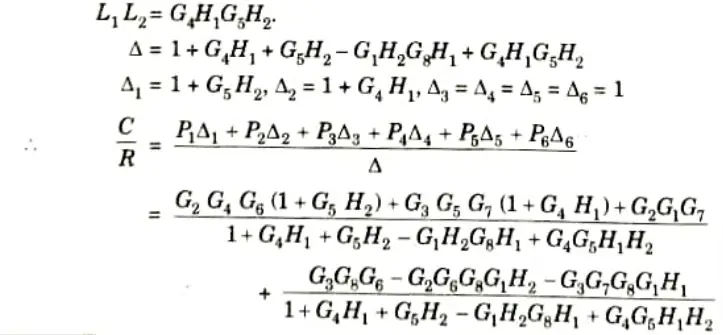
b. Find the overall gain of the system whose signal flow graph is shown below.
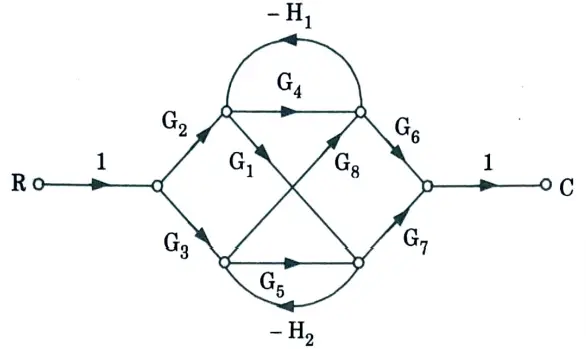
Ans. 1. The gain of the forward paths,

3. Two non-touching loops,
Section 4: Proportional Integral PI Controller
a. Compare proportional (P) control action with integral (I) control action and prove that by using proportional integral PI controller steady state error become zero in a system.
Ans. A. Comparison:
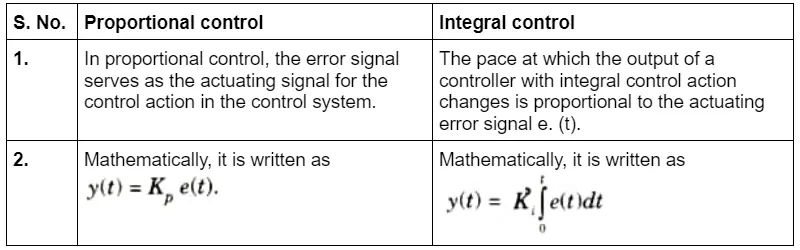
B. Proof:
1. A controller in the forward path, which changes the controller output corresponding to the proportional plus integral of the error signal is called PI controller.
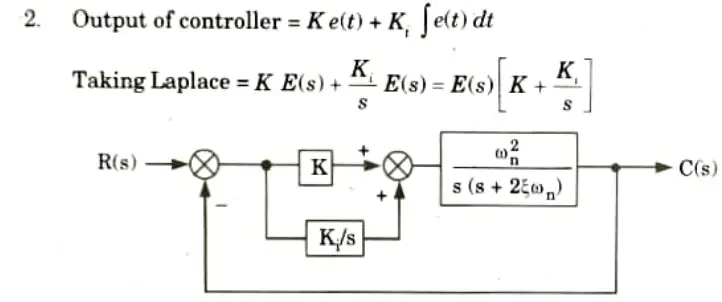
3. Assume, K = 1, we can write,
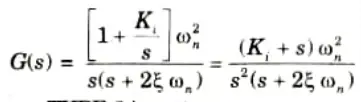
ie., system becomes TYPE 2 in nature.
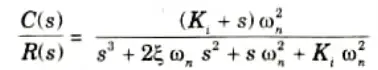
i.e., it becomes third order.
4. Now as order increases by one, system relatively becomes less stable as Ki must be designed in such a way that system will remain in stable condition. Second order system is always stable.
5. Hence as type is increased by one, error becomes zero for ramp type of input ie., steady state of system gets improved and system becomes more accurate in nature.
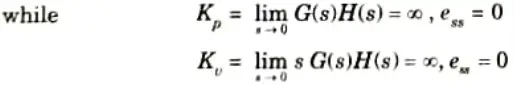
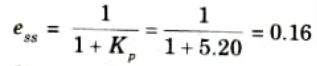
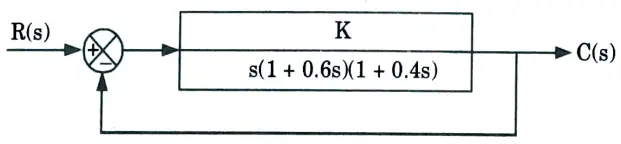
b. Find out various error coefficients : Kp, Kv, Ka and steady state error for standard step, ramp, and parabolic inputs for system shown below:
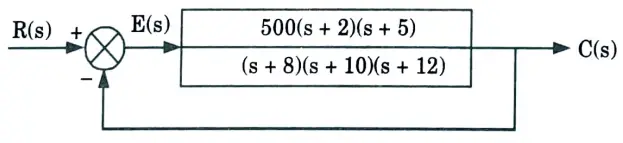
Ans. Given:
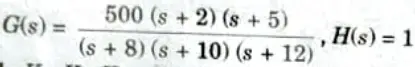
To Find: Kp, Kv, Ka and eSS
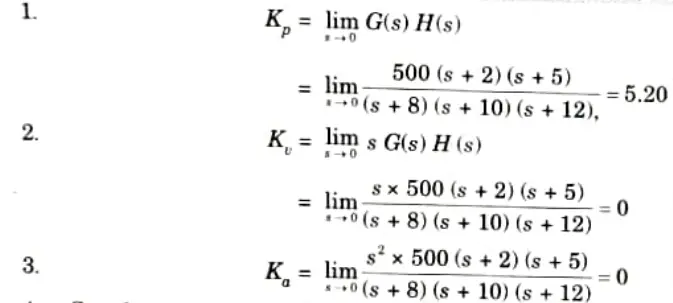
4. Steady state error for step input,
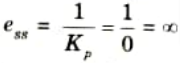
5. Steady state error tor ramp input,
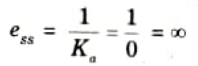
6. Steady state error for parabolic input,
Section 5: Effect of Pole Location
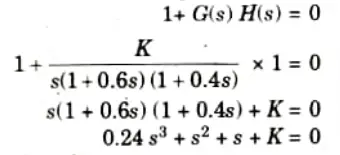
a. Explain the effect of pole location on stability of a system by suitable diagram, determine range of K and frequency of sustained oscillations for a given unity feedback system.
Ans. A. Effect of pole location on stability:
- 1. Poles on negative real axis
- 2. Pole on positive real axis
- 3. Pole at the origin
- 4. Complex pole in the left half of s-plane
- 5. Complex poles in the right half of s-plane
- 6. Poles on j𝛚-axis
B. Numerical:
Given:
To Find: Range of k, frequency of sustained oscillations.
1. The characteristic equation
2. The Routh array
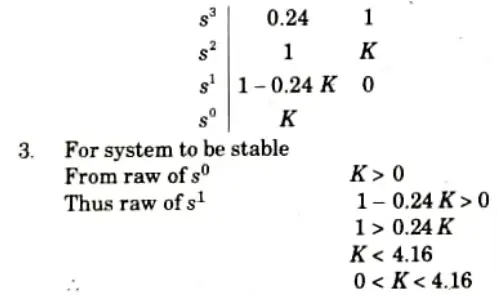
This is the range of K
4. For frequency of sustained oscillations
Auxiliary equation
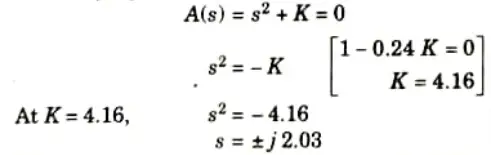
5. The frequency of sustained oscillations will be 2.03 rad/sec.
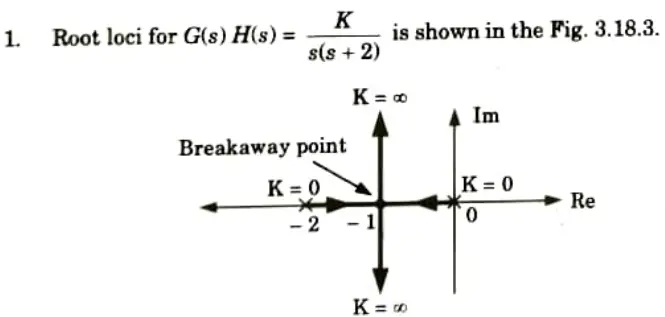
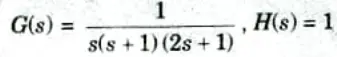
b. Sketch the root locus of the system whose open loop transfer function is G(S)=K/s(s +2)(s + 5). Find the value of K so that system is marginal stable find out damped frequency of oscillation, also find K when the damping ratio of the closed loop system is 0.5.
Ans. 1. Root locus:
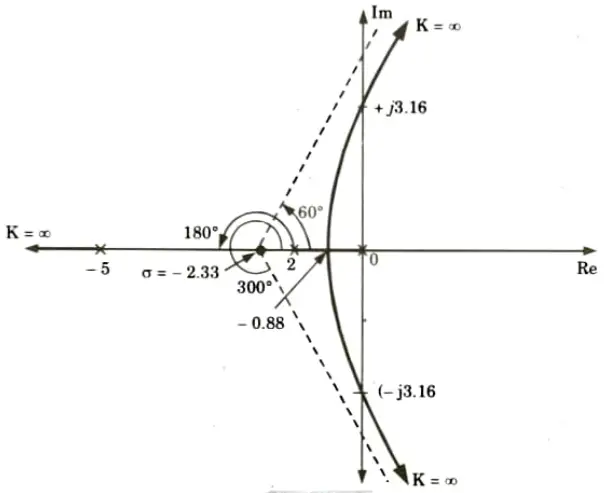
2. The value of K for marginally stable system, K = 70
3. The damped frequency of oscillation, 𝛚n = 1.44 rad/sec
4. The value of K when the damping ratio, 𝛏 = 0.5
K = 10.75
Section 6: Control System Important Questions
a. Sketch Bode plot for the following transfer function and determine the gain cross over frequency and phase cross over frequency, comment on stability.
G(s) H(s)= 10/s (1 + s) (1 +0.002s)
Ans.
Results from Bode plot:
- 1. Gain crossover frequency, 𝛚gc = 5.5 rad/sec
- 2. Phase crossover frequency, 𝛚pc = 15 rad/sec
- 3. Gain margin, GM = 10 dB
- 4. Phase margin, PM= 10°
Because the GM and PM both are positive. So the given system is stable.
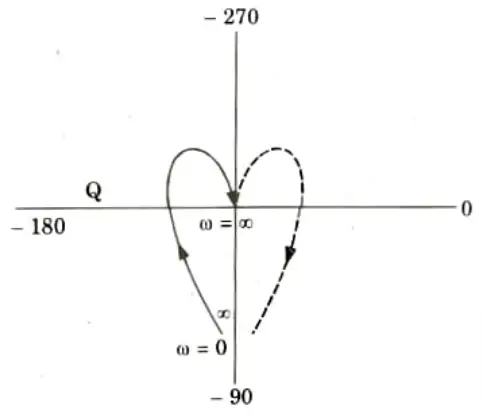
b. Draw the complete Nyquist plot for a unity feedback system having the open loop function; from this plot obtain all the information regarding stability.
G(s)H(s) = k/s(s + 3)(s + 5)
Ans. 1. P = 0 (Number of poles on R-H plane)
N = -1 [Because contour has infinite radius, so it encircle (-1,0) point]
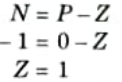
So the given system is unstable
Section 7: Control System Important Numerical
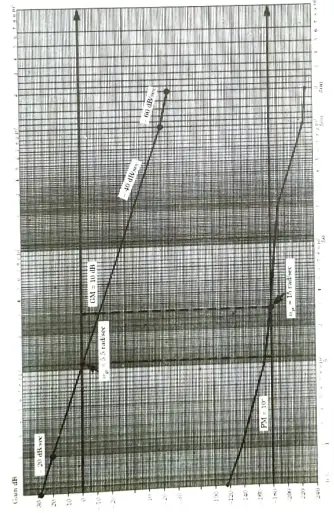
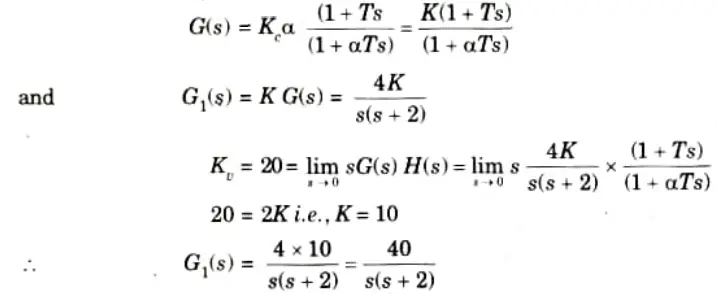
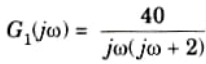
a. Design a lead compensator for a system whose open loop transfer function is
G(s)H(s) = 4s(s + 2)
It will fulfill following requirement
i. Static velocity error constant = 20 sec-1
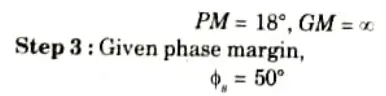
ii. PM at least 50°
iii. GM at least 10 db
Ans. Step 1: Assume a lead compensator as,
Step 2: Thus line of slope 20 dB/sec till 𝛚c = 2 and line of slope -40 dB/sec from 2 onwards.
Sketch the bode plot of G1(s)
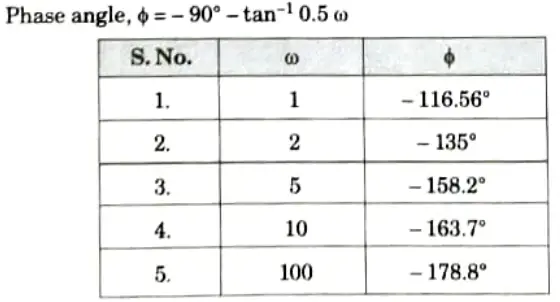
Phase angle table:
Phase Plot:
From the Bode Plot:
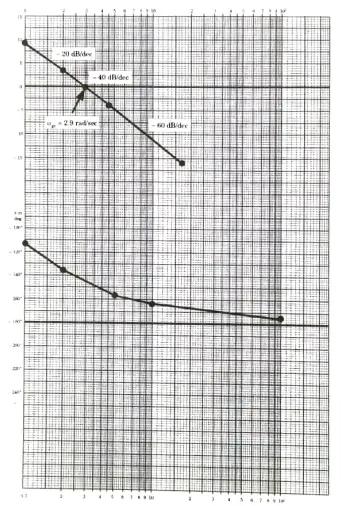
Maximum phase lead angle
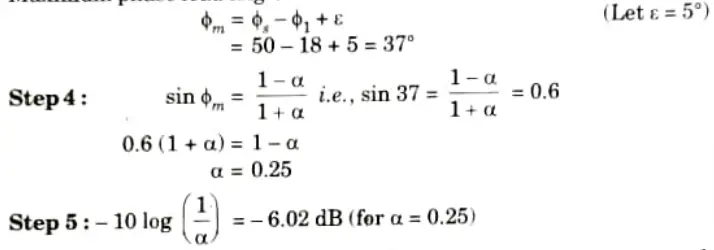
From Bode Plot find frequency at which gain of the uncompensated system is – 6.02 dB, this is 𝛚m
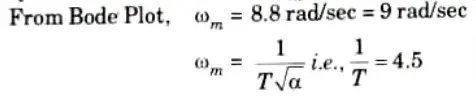
Step 6: Two corner frequencies of the lead compensator are,
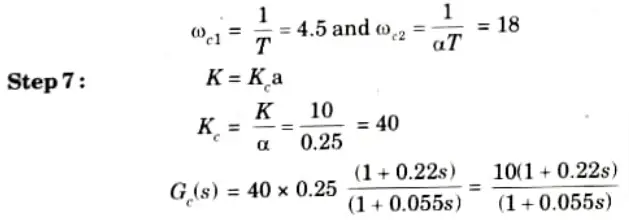
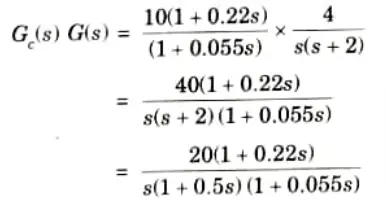
This is the designed lead compensator
b. Determine the state controllability and observability of the system described
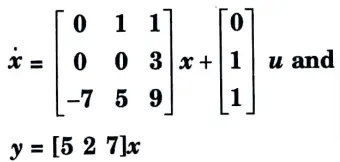
Ans. 1. Controllability test: Hence rank of Qc is equal to order i.e., 3. Therefore the system is controllable.
2. Observability test: Hence its rank of Qc is equal to 3, therefore the system is completely observable.
5 thoughts on “Control System: Solved Aktu Question Paper, Notes pdf”