Providing Last year question paper with solution – Network Analysis and Synthesis Question Paper -2022-23
SECTION:-A
1. Attempt all questions in brief:
a. Illustrate the admittance parameter of a two-port network.
ANS.1. A 2 x 2 admittance matrix serves as the two port network’s Y parameter. This admittance matrix reveals the link between the input and output current and voltage of the network since admittance is the ratio of circuit current to voltage.
2.Short circuit admittance parameter is another name for it.The Y parameter for a two port network is defined as
[I] = [Y] [V]
Where, [Y] is the admittance matrix, [I] and [V] are the current and voltage matrix.
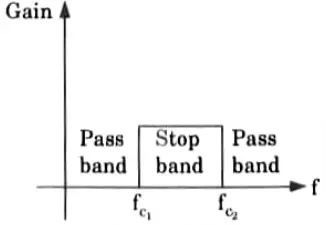
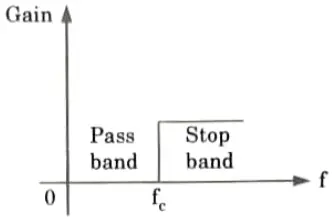
b. Describe the band stop filter with suitable examples.
Ans. Band reject filter : A band stop filter rejects or disallows transmission of a limited band of frequencies but allows transmission of all other frequencies and is shown in Fig
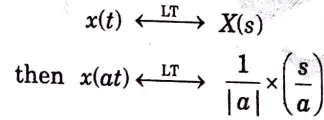
c. Demonstrate time scaling property of laplace transform.
Ans. The time scaling property of laplace transform states that if,
d. Describe the singularity function with suitable examples.
Ans. 1. Singularity is a point at which a function does not possess a derivative.
2. Each singularity function has an origin unique point and is 0 elsewhere.
3. Generalized functions are another definition for singularity functions. Instead of being defined by its value at every instant in time, a generalized function is defined by how it affects other functions.
4. Step, impulse and ramp functions are known as singularity functions.
5. The examples of singularity functions are :
i. Unit step signal
ii. Unit impulse signal
iii. Unit Ramp Signal.
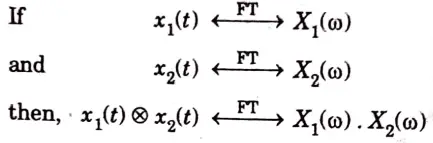
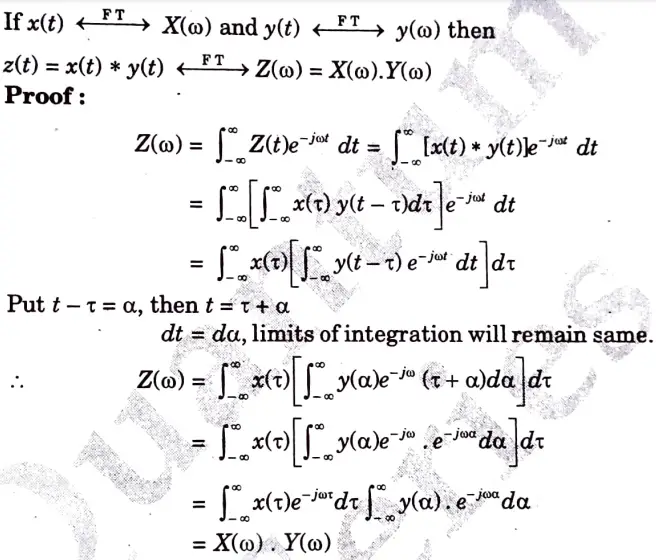
e. Demonstrate time convolution property of fourier transform.
Ans. Convolution (time-convolution) :
f. Illustrate the drawback of fourier transform and how this drawback can be removed by using laplace transform.
Ans: A. Drawbacks: 1. Without taking into account temporal aspects, Fourier transformation only provides the signal’s unique details. As a result, it is not appropriate for signal analysis with time-varying spectra (non stationary signals).
2. It has a fixed time resolution and a fixed frequency resolution, meaning that it has 100% frequency information but 0% time information.
B. Since the laplace transform exists even for signals for which the fourier transform does not, it is frequently employed to resolve differential equations.
B. The laplace transform is widely used for solving differential equations since the which laplace transform exists even for the signals for the fourier transform does not exist.
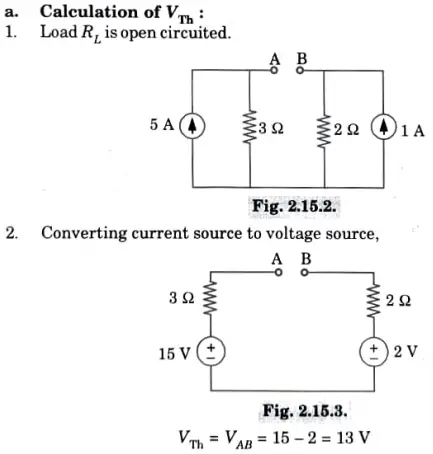
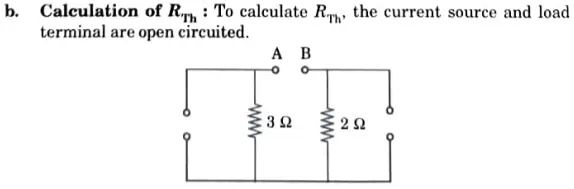
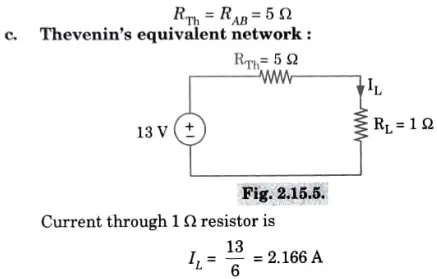
g. Describe and state Thevenin’s theorem with suitable example.
Ans. A. Statement:
An equivalent circuit that consists of a voltage source Vth in series with an impedance Zth can be used to replace any two terminal linear network that contains sources (generators) and impedances. When all energy sources are removed from the equation, Zth represents the measured impedance between the network’s terminals and Vth represents the open circuit voltage between them.
B. Thevenin’s theorem:
h. Describe the following terms for a network : Graph, Tree, Co-Tree, and Twig.
Ans: A. Graph: It consists of a set of nodes connected by branches. In graphs, a node is a common point of two or more branches.
B. Tree, Co-tree and Twig:
Trees: A connected graph’s “tree” is described as a collection of branches that connect each node in the graph without generating a loop.
Co-tree: A co-tree is the collection of all of the graph’s branches that aren’t found in the tree.
Twigs: the branches of a tree are called twigs.
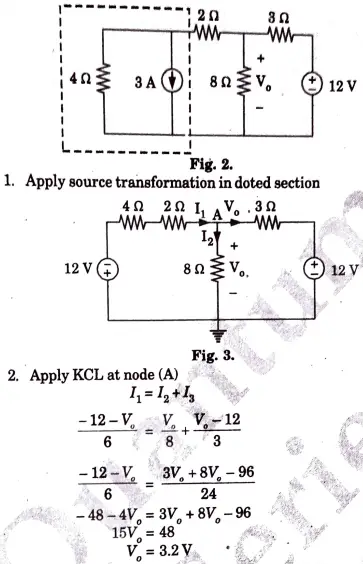
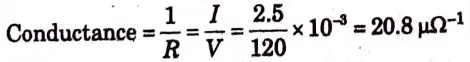
i. Use source transformation to solve V0 in the circuit shown in Fig.1.
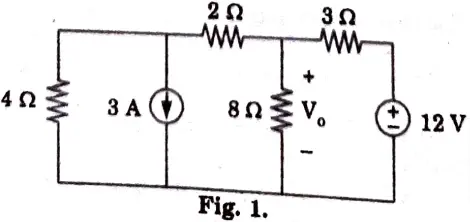
Ans.
j. When the voltage across a resistor is 120 V, the current through it is 2.5 mA. p calculate its conductance.
Ans. Given: V= 120 V, I = 2.5 mA
To Find: Conductance
SECTION-B
2. Attempt any three questions in brief:
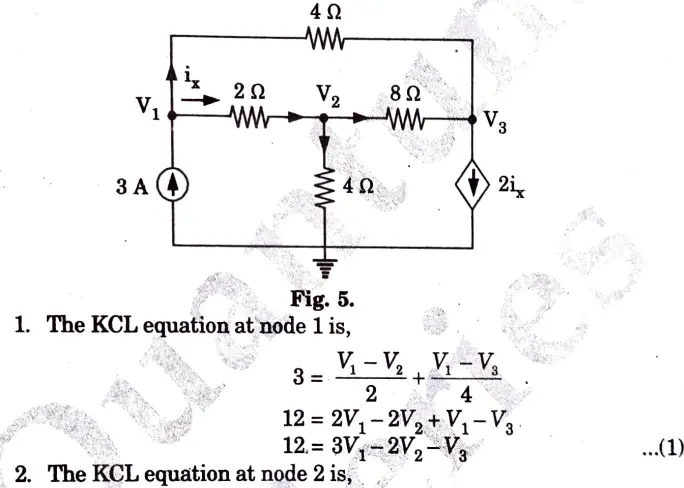
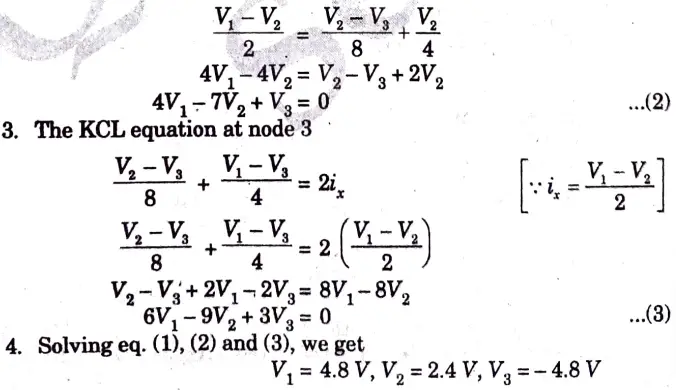
a. Identify the node voltages in the circuit shown in Fig. 4.
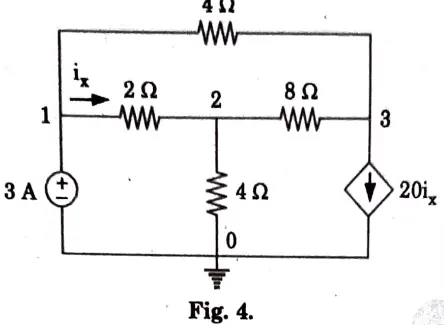
Ans.
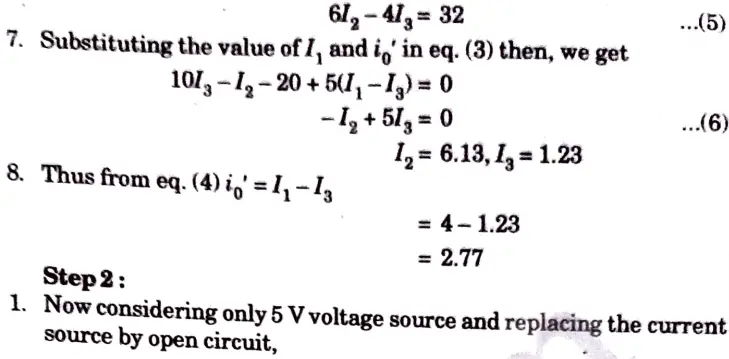
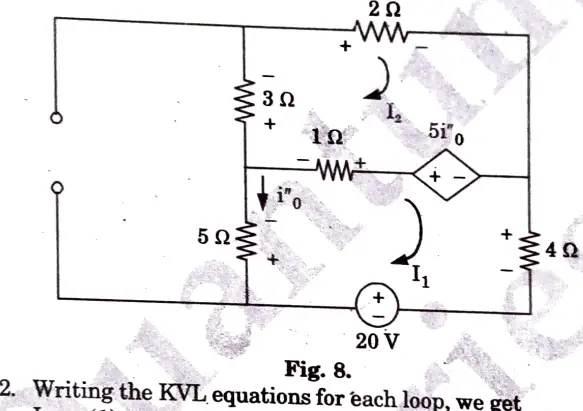
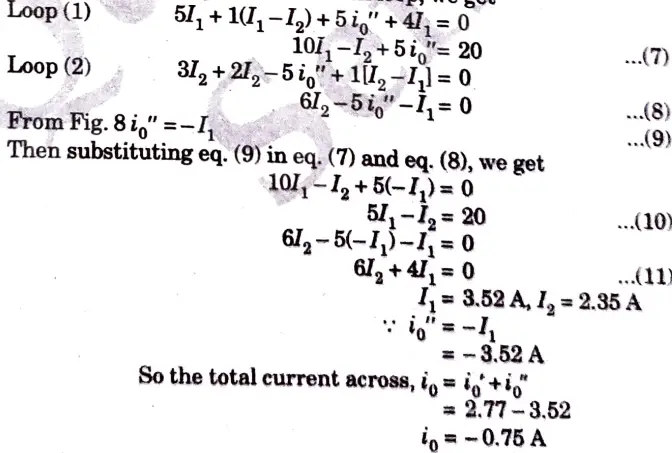
b. Find i0 in the circuit shown in the Fig. 6 using superposition
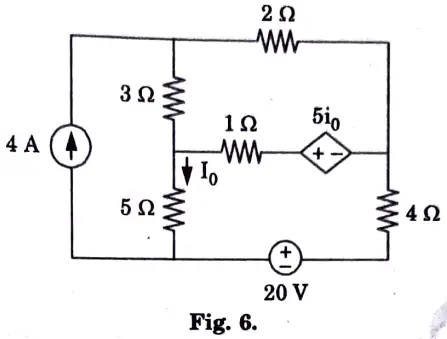
Ans. Step 1:
1. Considering 4 A current source and replacing the voltage source by short circuit,
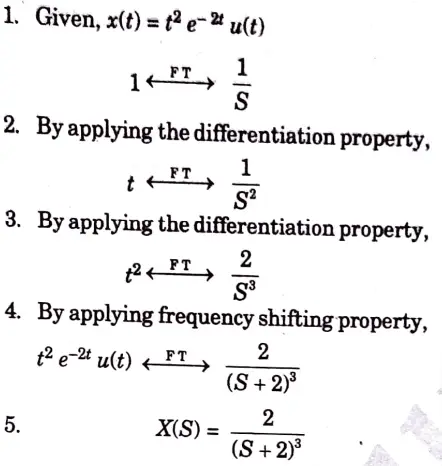
c. Calculate the fourier transform for the signal
x(t) = t2-eTu(t)
Ans.
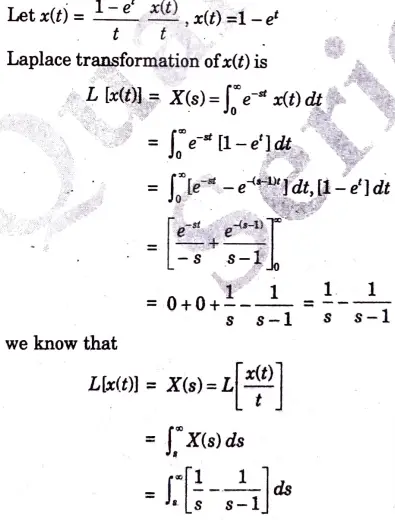
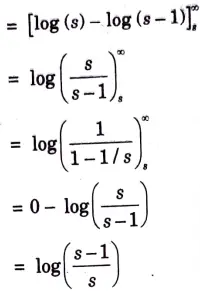
d. Find the laplace transform for the given signal.
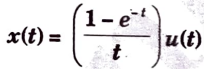
Ans.
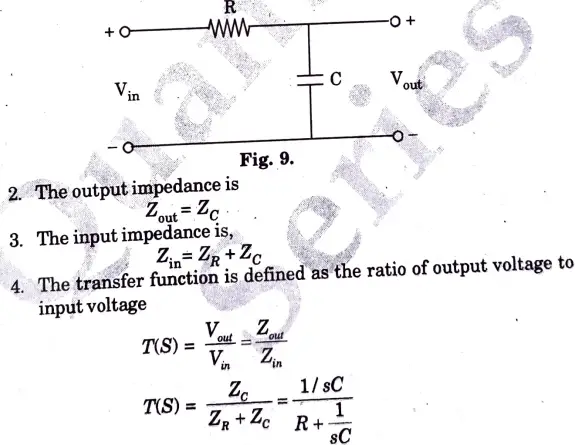
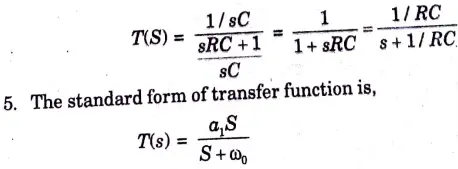
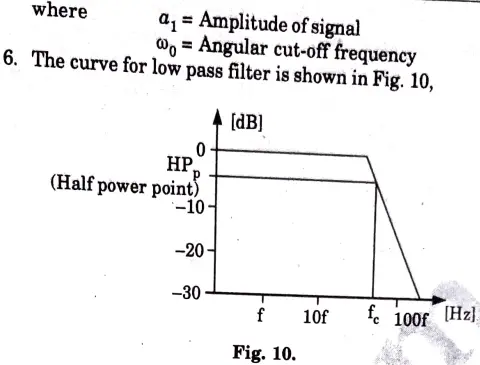
e. Illustrate the low pass filter. Derive the expression for the transfer function of a low pass filter and plot the curve.
Ans: A Low pass filter:All frequencies over the “cut-off frequency,” which is a fixed value, are rejected by these filters. Fig. depicts the attenuation characteristic of a perfect LP filter.
B. Derivation :
1. The first order high pass filter is shown in Fig. 9
SECTION:-C
3. Attempt any one part of the following:
a. Describe the following terms with an example.
i. Junction point
ii. N ode
iii. Branch
iv. Active and passive network .
v. Linear and non-linear network
Ans: junction point:A junction point is when three or more branches come together.
Node: An isolated point or the terminal of a branch constitutes a node. It is also known as a junction or a vertex.
Branch: A network element or group of elements connected between two points is represented by a line segment known as a branch.
Active and passive elements
Active elements are those that provide the network with energy.
Active elements include voltage sources like batteries, dc and ac generators, as well as current sources like photoelectric cells and metadyne generators.
Passive components are those that either dissipate or retain energy. Passive elements consist of capacitors, inductors, and resistors.
- Electric circuits that exclusively contain linear resistance are referred to as linear circuits, while resistive elements whose volt-ampere characteristics are straight lines are referred to as linear resistive elements.
- Electric circuits including resistive elements are known as nonlinear circuits because their volt-ampere characteristics are not a straight line for them.
Examples of the following terms :
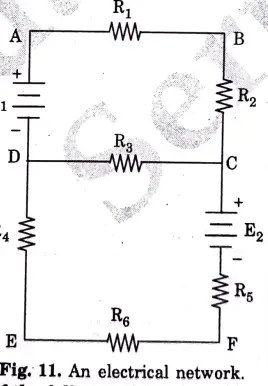
1. Node: In the network shown in Fig, 11, A, B, C,D, E and Fare the nodes of the network.
2. Junction point: Point C and D are the junction points in the network shown in Fig. 11.
3. Branches: In the Fig, 11, AB, BC, CD, DA, DE, CF and EF are the various branches.
4. Linear network: The examples of linear network are resistance, capacitance and inductance.
5. Non-linear network: The examples of non-linear network are diode, transistor and FET.
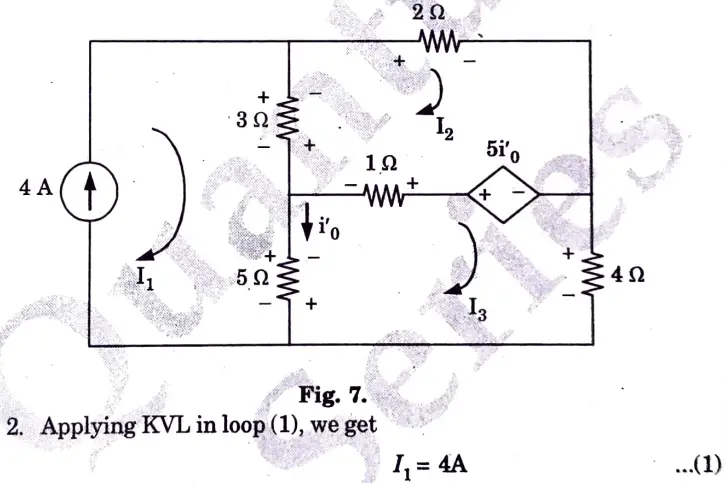
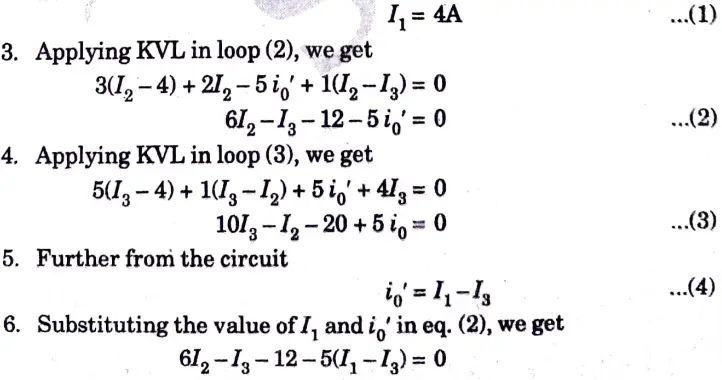
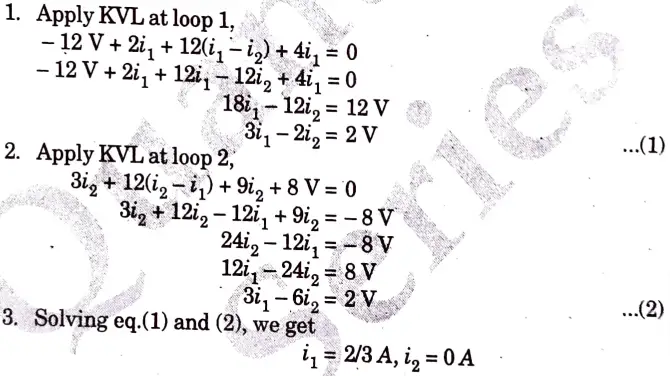
b. Calculate the mesh currents i1 and i2 in the circuit shown in Fig.
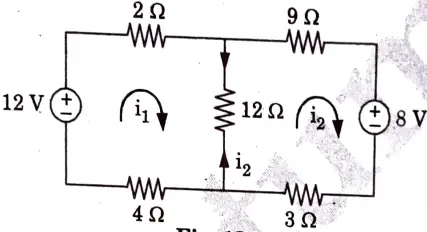
Ans.
4. Attempt any one part of the following
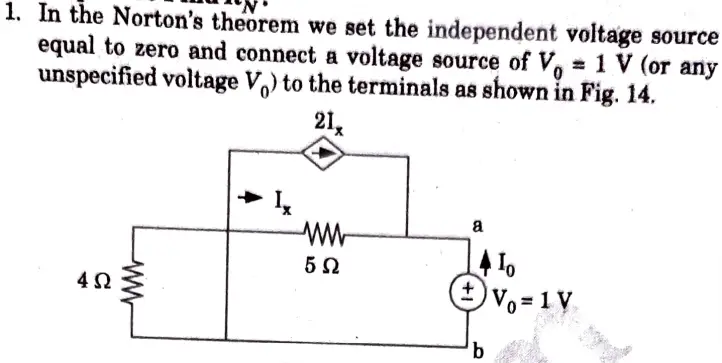
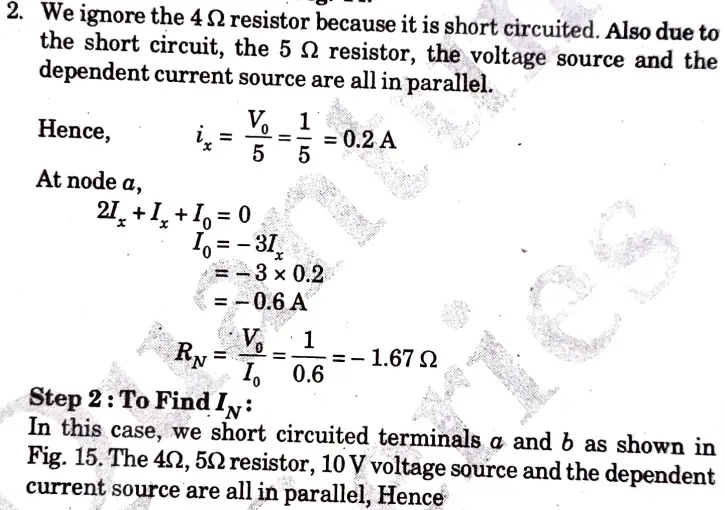
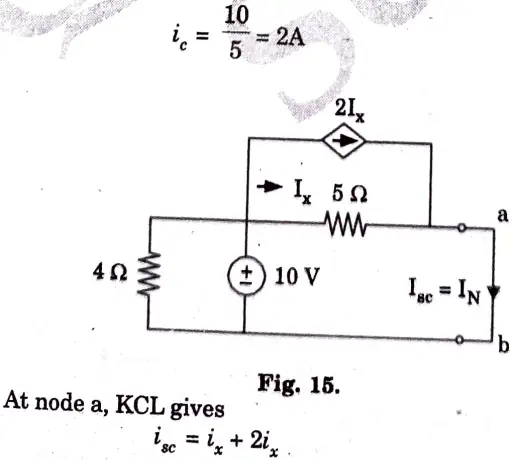
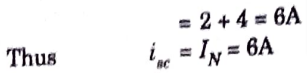
a. Using Norton’s theorem, find RN and IN of the circuit shown in Fig.
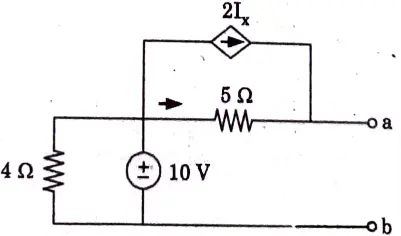
Ans. Step 1: To Find RN:
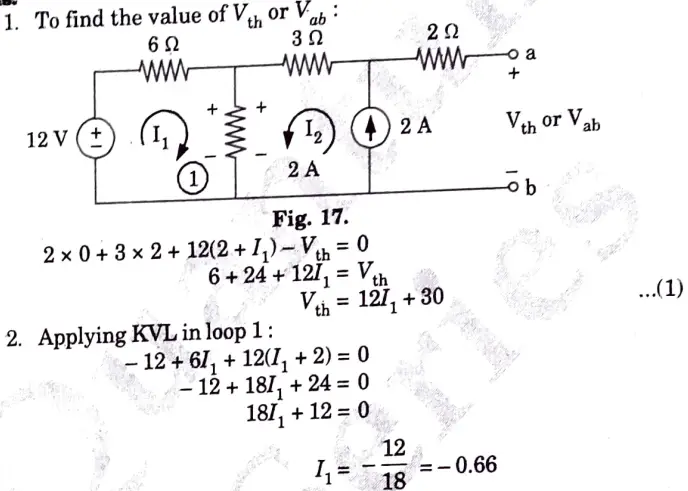
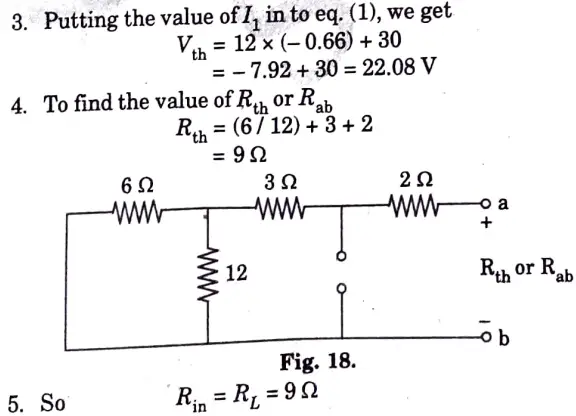
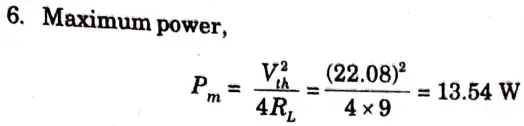
b. Find the value of RL for the maximum power transfer in the circuit shown in Fig. 16. Find the maximum power.
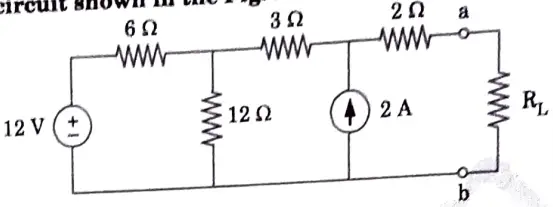
Ans.
5. Attempt any one part of the following:
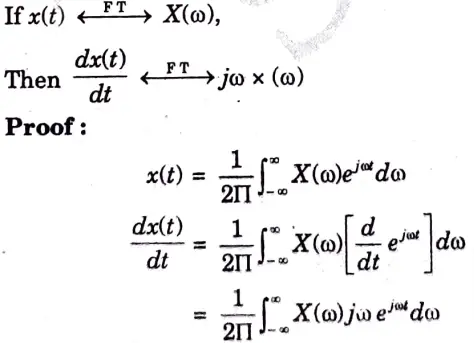
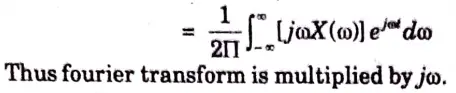
a. Demonstrate and prove the frequency convolution and time differentiation property of fourier transform.
Ans. A. Convolution:
Statement:
B. Time-Differentiation:
Statement :
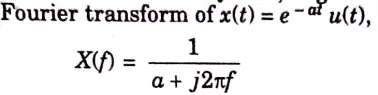
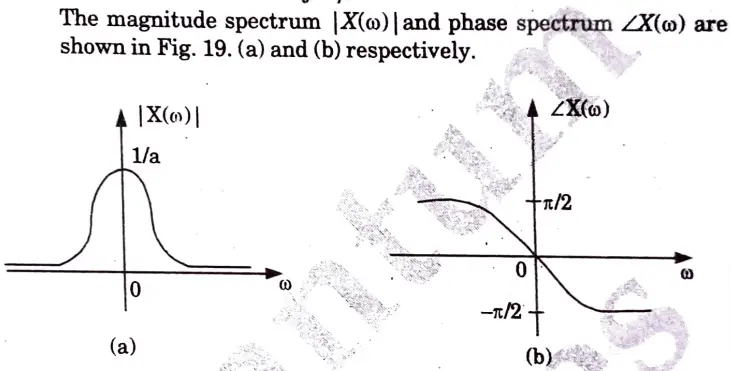
b. Find out the fourier transform of x(t) = e-atu(t). Also draw the magnitude and phase spectrum of the output.
Ans.
6. Attempt any one part of the following:
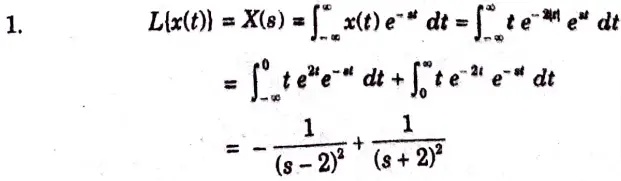
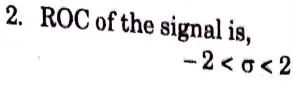
b. Find the laplace transform for the given signal and calculate the ROC.

Ans. Given
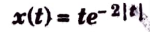
To Find: i. Laplace transform x(s).
ii. ROC
7. Attempt any one part of the following:
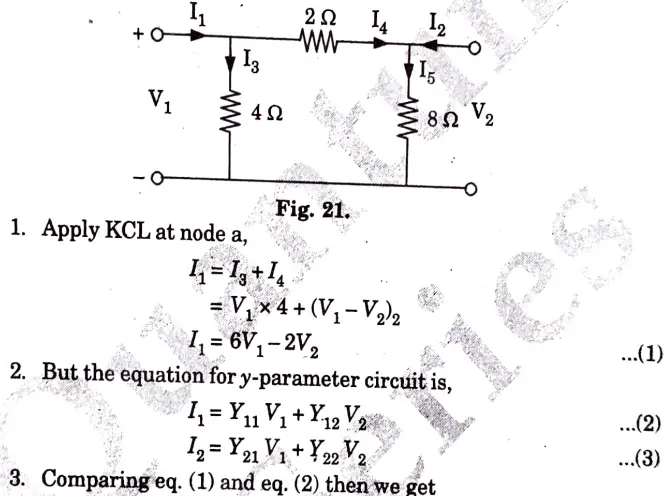
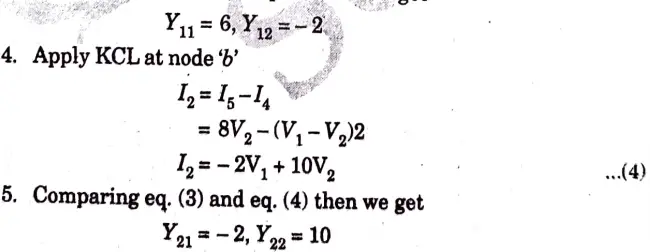
a. Obtain these parameters for the circuit shown in Fig. 20.
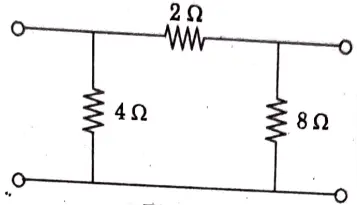
Ans. The circuit is shown in Fig. 21.
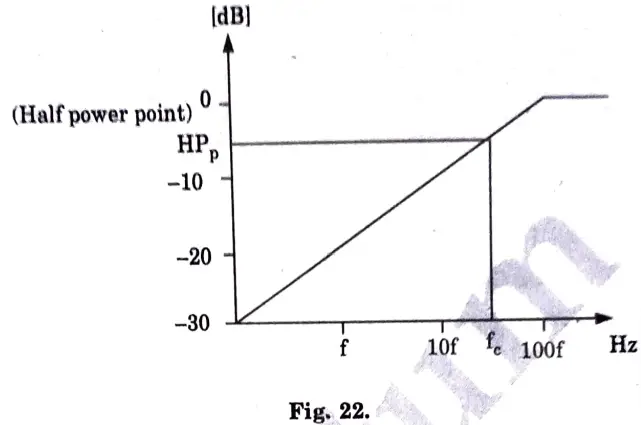
b. Illustrate the high pass filter, Derive the expression for transfer function of a high pass filter and plot the curve.
Ans. The curve for high pass filter is shown in Fig. 22,

Network Analysis and Synthesis Important Links:
| Label | Link |
|---|---|
| Subject Syllabus | Syllabus |
| Short Questions | Short-question |
| Important Unit-1 | Unit-1 |
| Important Unit-2 | Unit-2 |
| Important Unit-3 | Unit-3 |
| Important Unit-4 | Unit-4 |
| Important Unit-5 | Unit-5 |
| Question paper – 2021-22 | 2021-22 |
Network Analysis and Synthesis Quantum PDF: | AKTU Quantum PDF:
| Quantum Series | Links |
| Quantum -2022-23 | 2022-23 |
AKTU Important Links | Btech Syllabus
| Link Name | Links |
|---|---|
| Btech AKTU Circulars | Links |
| Btech AKTU Syllabus | Links |
| Btech AKTU Student Dashboard | Student Dashboard |
| AKTU RESULT (One VIew) | Student Result |
1 thought on “Network Analysis and Synthesis Question Paper -2022-23”