With our AKTU question paper and solution, you can start on a thrilling trip of Industrial Engineering. Student-friendly notes educate young students to the topics of efficiency and optimization in an enjoyable and interesting way.
Dudes 🤔.. You want more useful details regarding this subject. Please keep in mind this as well.

Important Questions For Industrial Engineering:
*Quantum          *B.tech-Syllabus
*Circulars           *B.tech AKTU RESULT
* Btech 3rd Year
Section A: Industrial Engineering Short Notes
a. Write short note on productivity.
Ans. Productivity is defined as the ratio of actual output (production) to what it takes to produce it (inputs). That is difficult to supervise. Output refers to the amount or number of products produced, whereas inputs refer to the numerous resources used, such as land, buildings, equipment and machinery, materials, labour, and so on.
b. What is group technology ?
Ans. Group technology is a manufacturing concept in which related parts are found and put together to capitalise on their design and production similarities.
c. Define forecasting.
Ans. Forecasting is the estimation of the type, quantity, and quality of future work, such as sales. Forecast shows the sales department’s and each of its divisions’ commitment to predicted sales. It becomes a benchmark by which the sales department’s effectiveness is judged.
d. What do you mean by scheduling ?
Ans. Scheduling entails creating a timetable that shows the total time required to make a product as well as the time estimated to be spent at each equipment and process.
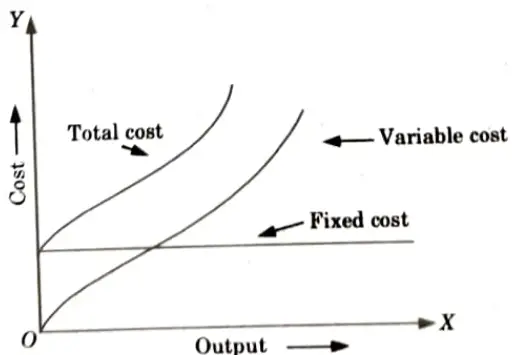
e. Draw the cost curve for fixed cost, variable cost and total cost.
Ans.
f. What is safety stock ? How it is important ?
Ans. Safety Stock: It is an additional quantity of product kept in the warehouse to avoid a stock out issue.
Important of Safety Stock: It helps reduce the trouble of running out of stock. It also protects you from price volatility.
g. What are the objectives of standardization ?
Ans. Objectives of standardization are as follows:
- 1. Assists in maximising overall economy.
- 2. Ensures optimal ease of use.
- 3. Uses the best solutions to reoccurring problems.
- 4. Facilitates the interchange of products and services on a national and worldwide scale.
h. What do you understand by ergonomics ?
Ans. Ergonomics is defined as the study of the link between man and machine, as well as the application of anatomical, physiological, and psychological concepts to problems that arise from this relationship.
i. What are the limitations of graphical method for solving LPP ?
Ans. Limitations of graphical method for solving LPP are as follows:
- 1. Linear programming only works with linear variables.
- 2. It addresses a problem with a single goal.
- 3. Non-linear functions cannot be solved in this context.
- 4. The inability of the graphical technique to solve some problems with more than two variables.
j. Describe the unbounded solution and no solution conditions with the help of diagram.
Ans. Unbounded Solution: Unbounded solutions of LPP exist when the value of the objective function can be increased or decreased indefinitely without restriction. In this case, the best option may or may not exist.
Section B: Industrial Engineering Important Notes
a. Describe process and product layout in detail. Also mention benefits and limitations of both.
Ans. A. Process Layout:
- 1. It is also known as functional layout and is distinguished by the concentration of related devices or operations in a single location.
- 2. This pattern is commonly used in companies that perform task order production and non-repetitive maintenance or manufacturing activities.
a. Benefits:
- 1. There is a great deal of leeway in allocating work to equipment and personnel.
- 2. Improved utilization of available equipment.
- 3. A smaller number of machines are required, resulting in a lower capital expenditure.
- 4. Improved product quality.
b. Limitations:
- 1. Process layout requires greater area for the same amount of production.
- 2. It is incredibly difficult to automate material handling.
- 3. The inventory of work-in-process items is substantial.
B. Product Layout:
- 1. It is sometimes referred to as line type layout. It indicates that various operations on raw material are conducted in a sequential order, and the machines are positioned along the product flow line, i.e., the machines are arranged in the order in which the raw material will be worked on.
- 2. This layout is favoured for continuous manufacturing, i.e., a continuous flow of in-process material to the finished product stage.
a. Benefits:
- 1. Requires less area for the same volume of manufacturing.
- 2. Material handling that is automated results in fewer material handling movements, delays, and costs.
- 3. Reduced inventory in process.
- 4. The product is completed in less time.
b. Limitations:
- 1. Because the layout is determined by the stated product, a change in product results in a significant change in layout, reducing layout flexibility significantly.
- 2. Requires more capital investment.
b. What is material requirements planning (MRP) ? Discuss its structure in detail. Also describe JIT manufacturing system.
Ans. A Material Requirements Planning (MRP):
- 1. Material requirements planning (MRP) is a computational technique that turns the master schedule for finished goods into a detailed schedule for the raw materials and components utilized in the finished goods.
- 2. The comprehensive schedule lists the quantities of each raw material and component. It also specifies when each item must be ordered and delivered in order to fulfil the master schedule for finished goods.
- 3. MRP is frequently regarded as a method of inventory control. It is an excellent tool for reducing excessive inventory investment as well as a beneficial strategy in production scheduling and material purchasing.
- 4. MRP is the best technique for calculating the amounts of dependant goods.
- 5. Manufacturing inventory consists of the following items: raw materials, work in process (WIP), component parts, and subassemblies.
B. JIT:
- 1. JIT is a Japanese production management philosophy that has been used in many Japanese industrial enterprises since the early 1970s.
- 2. Because Toyota Company pioneered this approach in Japan, it is also known as the ‘Toyota manufacturing system.’
- 3. Just in time promotes waste minimization, absolute quality control, and client dedication.
- 4. Elimination of waste from the manufacturing process is one of the system’s core concepts. Its purpose is to continuously pursue waste reduction while optimizing processes and procedures.
- 5. This entailed eliminating waste and utilizing goods and resources as efficiently as feasible.
- 6. This is accomplished through an emphasis on a continual stream of modest changes known in Japan as ‘Kaizen,’ which has been identified as one of the most important aspects of JIT philosophy.
- 7. JIT manufacturing is defined as a “philosophy that focuses on avoiding waste by procuring or making just enough of the correct things just in time.”
- 8. This entails having the correct products in the right place and at the right time, in the proper amount and quality.
- 9. Toyota Motor Company has identified seven wastes as priorities for continual improvement in manufacturing operations. Improvement is obtained by addressing these wastes.
c. What is break-even point in business ? Show this point on diagram. Explain ABC analysis and VED analysis in inventory control.
Ans. A. Break-Even Point: It is concerned with determining the exact moment at which revenues and costs are equal. This is known as the break even point.
B. ABC Analysis:
- 1. ABC analysis is a method of categorizing materials based on the quantity consumed and their relative values.
- 2. Inventory management technique ABC (Always Better Control). A category is made up of high-priced product that may be few in quantity but is very expensive.
- 3. Because the products in B category are less expensive inventory than those in A category, and because the number of things in B category is moderate, the control level is also moderate.
- 4. The C category contains a large number of inventory products that require less investments, so the control level is low.

C. VED Analysis:
- 1. The VED analysis seeks to categorize the goods used into three major categories: vital, essential, and desirable.
- 2. The analysis categorises items based on their importance to the industry or company.
- 3. Vital: The vital category items are those without which the company’s production or any other activity would come to a standstill, or would be severely hampered.
- 4. Essential: Vital items are those for which the company’s stock-out cost is particularly high.
- 5. Desirable: Desired items are those whose stockout or shortage causes just a slight disturbance in the manufacturing plan for a brief period of time. The expense incurred is minimal.
- 6. VED analysis is extremely beneficial for categorizing spare parts and components.
d. What is method study and what are its objectives ? Explain the principle of motion economy in detail.
Ans. A. Method Study and its Objectives:
Method Study: Method study is the systematic recording and critical assessment of existing and planned work techniques in order to develop and use easier and more effective methods while reducing expenses. It is a methodical approach to analyzing work in order to reduce needless procedures.
Objective of Method Study:
- 1. It improves the proper utilization of manpower, machine and materials.
- 2. It also improves the factory layout, work place, etc.
- 3. It also improves the process and procedure.
- 4. It develops better physical working environment.
- 5. It reduces undesirable fatigue.
B. Principle of Motion Economy:
- 1. Gilbreth’s motion economy principles envision the correct application of theories behind motion elements to accomplish synchronization of human body movements, best workplace architecture, optimum design of equipment and tools, and time conservation.
- 2. There are four basic principles of motion economy which are listed below:
- i. Principles related to human body.
- ii. Principles related to the arrangement of work place.
- iii. Principles related to design of tools and equipment.
Section 3: Simple Exponential Smoothing
a. A firm has adopted simple exponential smoothing with 𝛂 = 0.1 to forecast its demand. The forecast for January was 500 units, whereas actual demand was 450 units. Forecast the demand for February. Assume that actual demand during February is 510 units, forecast the demand for the month of March. Continue forecasting up to June, assuming that subsequent demands were actually 520, 490 and 470 respectively. Also differentiate between PERT and CPM.
Ans. A Numerical:
1. Demand for January = 500 units
Actual demand for January = 450 units
𝛂 = 0.1
Demand for February = 𝛂 x Demand for January + (1 – 𝛂) x Actual demand for January
= 0.1 x 500 + 0.9 x 450
= 455 units
2. Actual demand for February = 510 units
Demand for March = 𝛂 x Demand for February + (1 – 𝛂) x Actual demand for February
= 0.1 x 455 + 0.9 x 510
= 504.5 units
3. Actual demand for March = 520 units
Demand for April = 0.1 x 504.5 + 0.9 x 520
= 518.48 units
4. Actual demand for April = 490 units
Demand for May = 0.1 x 518.45 + 0.9 x 490
= 456.845 units
5. Actual demand for May = 470 units
Demand for June = 0.1 x 456.845 + 0.9 x 470
= 468,6845 units
B. Difference between PERT and CPM:
| S. No. | PERT | CPM |
| 1. | It is a probabilistic model. | It is a deterministic model. |
| 2. | It does not deal with concept of crashing. | It deals with concept of crashing. |
| 3. | It is known for non repetitive jobs like research and development. | It is used for repetitive jobs like residential construction. |
| 4. | The use of dummy activities is required for representing the proper sequencing. | The use of dummy activities is not| necessary. |
| 5. | PERT analysis does not usually consider costs. | CPM deals with costs of project schedules and their minimization. |
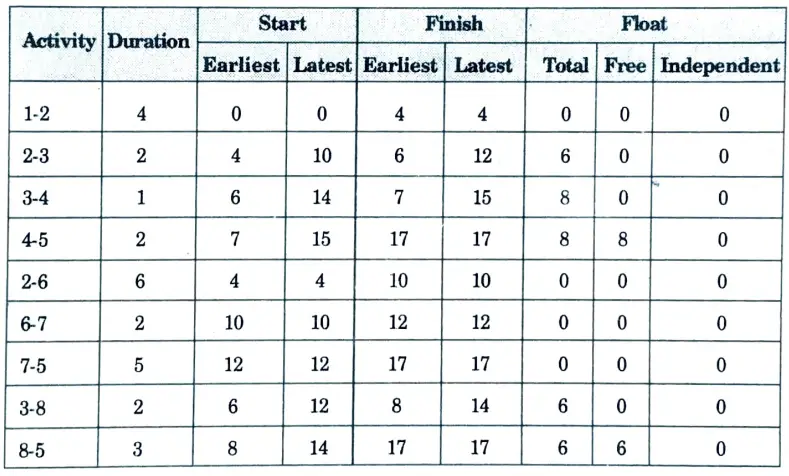
b. A network is formed by the following activities. The duration of the activities are given below: Draw the network, calculate the project completion time, identify the critical path and draw a table showing total float, free float, and independent float for each activity.
| Activity | Preceded by | Duration (Days) |
| A | Starting | 4 |
| B | A | 2 |
| C (Terminal) | D | 5 |
| D | E | 2 |
| E | A | 6 |
| F | B | 1 |
| G | B | 2 |
| H (Terminal) | E, G | 3 |
| I (Terminal) | F | 2 |
Ans. 1. The network diagram for the given problem is shown below:
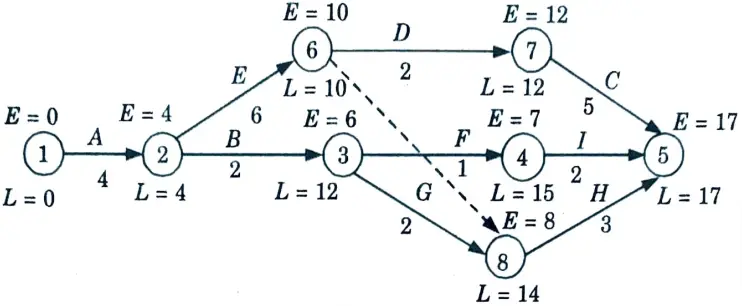
The critical path is A – E – D – C(1 – 2 – 6 – 7 – 5) and the project completion time is 4 + 6 + 2 + 5 = 17
3. Total float, free and independent float are given in the table below:
Section 4: Production System
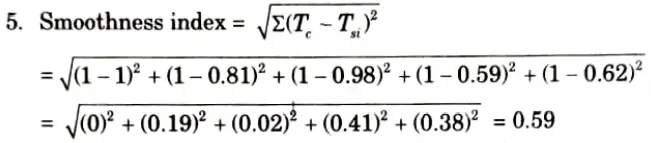
a. For the following set of elements draw the precedence diagram, balance the line and determine (i) Balance delay (ii) Line efficiency (iii) Smoothness index. Assume cycle time as one minute.
| Element | Station Time Tsi (minute) | Precedence |
| 1 | 0.2 | – |
| 2 | 0.4 | – |
| 3 | 0.7 | 1 |
| 4 | 0.1 | 1, 2 |
| 5 | 0.3 | 2 |
| 6 | 0.11 | 3 |
| 7 | 0.32 | 3 |
| 8 | 0.6 | 3.4 |
| 9 | 0.27 | 6, 7, 8 |
| 10 | 0.38 | 5, 8 |
| 11 | 0.5 | 9, 10 |
| 12 | 0.12 | 11 |
Ans. 1. Listing all the elements in the decreasing order of their station time, we get
| Element | Station Time Tsi (minute) | Precedence |
| 3 | 0.7 | 1 |
| 8 | 0.60 | 3, 4 |
| 11 | 0.50 | 9, 10 |
| 2 | 0.4 | – |
| 10 | 0.38 | 5, 8 |
| 7 | 0.32 | 3 |
| 5 | 0.3 | 2 |
| 9 | 0.27 | 6, 7, 8 |
| 1 | 0.2 | – |
| 12 | 0.12 | 11 |
| 6 | 0.11 | 3 |
| 4 | 0.1 | 1, 2 |
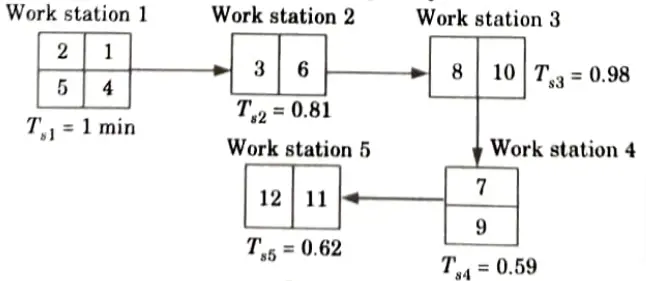
TWC = 4
2. The precedence diagram for the given problem is shown below:
3. Line efficiency
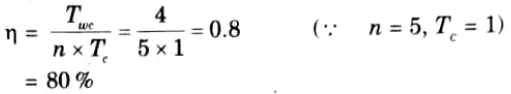
4. Balance delay = 1 – 𝜂 = 1 – 0.8 = 0.2 = 20 %
b. What do you mean by production system ? How it is classified ? Describe intermittent production system in detail.
Ans. A. Production System:
- 1. A production system is the deliberate act of generating something.
- 2. A production system involves the production of things through the use of efficient management and the use of land, labour, machinery, capital, and materials.
- 3. A production system is an efficient process with a well-organized mechanism for converting input materials into valuable output items.
B. Classification and Intermittent Production System:
Intermittent System:
- 1. In this method, things are manufactured specifically to fill customer requests rather than for stock.
- 2. Intermittent production systems have production facilities that are adaptable enough to accommodate a wide range of products and sizes.
Features of an Intermittent System:
- 1. Demand can be discontinuous.
- 2. All operational stages may not be balanced.
- 3. Elaborate sequencing and scheduling is required.
- 4. Needs high investment.
- 5.Planning, routing and scheduling changes with fresh orders.
- 6. Storage is necessary at each stage of production process.
- 7. Can adjust to new situation and specification.
- 8. Inspection is not in line with production.
Types of Intermittent System: There are two types of intermittent system:
i. Job Production or Project Type Production: With this approach, goods are manufactured in response to specific customer orders.
Example: Ship building, dam construction, bridge building, book printing, etc.
ii. Batch Production: Items are processed in lots or batches, as opposed to job type systems, which create one item every production run.
Example: Biscuit and confectionery and motor manufacturing, medicines, tinned food and hardware like nuts and bolts etc.
Section 5: Product Life Cycle
a. Explain product life cycle in detail. Also discuss about concurrent engineering.
Ans. A. Product Life Cycle:
- 1. The concept of a product life cycle has taken centre stage in marketing literature, serving as both a forecasting tool and a guideline for corporate marketing strategy.

- 2. In its most basic form, it serves as a descriptive model of a product’s stages of market acceptability.
- 3. It is thus the “supply” view of the diffusion model, which envisions a product reaching the customer via a “diffusion” process.
B. Concurrent Engineering:
- 1. Decreased product development time.
- 2. Improved profitability.
- 3. Better control on design and manufacturing costs.
- 4. Greater competitiveness.
- 5. Improved product quality.
- 6. Close integration between departments.
b. What is value engineering ? What are its uses ? Describe the steps involved in value analysis.
Ans. A. Value Engineering:
- 1. Value Engineering (VE) is concerned with the development of new products. It is used during the product development process.
- 2. The emphasis is on lowering costs, enhancing function, or both through team-based product examination and analysis.
- 3. This occurs prior to the investment of capital in tooling, plant, or equipment.
- 4. Value engineering should be viewed as a critical activity late in the product development process and is unquestionably a sensible commercial investment in terms of time.
- 5. It is strongly advised that you incorporate value engineering into your new product development process to strengthen it and for commercial reasons.
B. Uses of Value Engineering:
- 1. Import substitutes.
- 2. Machine tool industry.
- 3. Industries making material handling equipments.
- 4. Auto industries, etc.
C. Steps Involved in Value Analysis:
- Step-1: The first stage is to determine which product will be subjected to value analysis. The product should be one that, if revamped, can increase sales and will not become obsolete in the near future.
- Step-2: The information relevant to the product may be as follows:
- i. Technical specifications with drawings,
- ii. Manufacturing processes, machine layout and instruction sheets,
- iii. Time study details and manufacturing capacity,
- iv. Complete cost data and marketing details, and
- v. Latest developments in related products.
- Step-3: Determine the product’s primary, secondary, and tertiary roles. Determine the value content of each function and the high-cost areas.
- Step-4: Knowing the functions of each component part and its production specifics generates ideas and varied choices for increasing the product’s value.
- Step-5: The various ideas collected in step 4 are compared, reviewed, and critically assessed for their merits, validity, and practicality in terms of financial and technological requirements.
- Step-6: Comprehensive development plans are created for the ideas that appear to be the most suitable and promising during stage 5. Drawing sketches, making models, and conducting conversations with the buy section, finance section, marketing division, and so on are all part of the development plans.
- Step-7: Step-6 converts the best discovered idea into a prototype manufacture, which eventually goes into operation and its results are recorded.
Section 6: Industrial Engineering Numerical
a. In a work shop, certain type of machines break-down at an average rate of 6 per hour. The breakdowns are in accordance with Poisson process. The estimated cost of idle machine is 16 rupees per hour. Two repairmen Xand Y with different skills are being considered to be hired as repairmen. Repairman X takes six minutes on an average to repair a machine and his wages are 9 rupees per hour, whereas the repairman Y takes five minutes to repair and the wages are 10 rupees per hour. Which repairman’s service should be used and why ? Consider the work shift of 8 hours.
Ans. 1. Total wages for repairman, X = Hourly rate x Number of hours
= 9 x 8 = Rs. 72
Total wages for repairman Y= 10 x 8 = Rs. 80
2. Cost of non-productive time
= (Average number of machines in the system) x (Cost of idle machine hour) x (Number of hours)
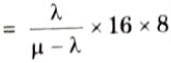
3. For repairman X,
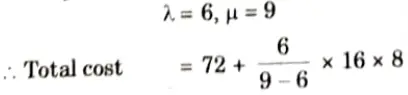
= 72 + 256 = Rs. 328
4. For repairman Y,
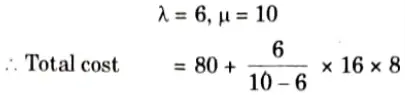
= 80 + 192 = Rs. 272
5. Repairman Y service should be used because of less cost.
b. For a production system annual demand is 8000 unit and ordering cost is’ 17000 rupees per order and inventory holding cost is 10 % of unit price. Items can be purchased in a lot as given below determine the best order size.
| Lot size | Unit price (In rupees) |
| 1 to 999 | 200 |
| 1000 to 1499 | 180 |
| 1500 to 1999 | 170 |
| 2000 & above | 165 |
Ans. Given: R = 8000 unit, C3 = Rs 17000, I = 0.1, b1 = 999, b2 = 1499, b3 = 1999, P1 = Rs 200, P2 = Rs 180, P3 = Rs 170, P4 = Rs 165
To Find: Economic order quantity.
1. The given problem has three price break, so computing q4 using formula given below :
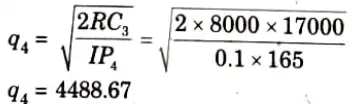
2. As q4 > b3 so optimal quantity is 4488.67 ≃ 4490.
Section 7: Vogel’s Approximation Method
a. Two products A and B are to be machined on three machine tools M1, M2 and M3. Product A takes 10 hrs on machine M1, 6 hrs on machine M2 and 5 hrs on machine M3. The product B takes 7.5 hrs on machine M1, 9 hrs on machine M2 and 13 hrs on machine M3. The machining time available on these machine tools M1, M2, M3 are respectively 75 hrs. 54 hrs and 65 hrs per week. The producer contemplates profit of Rs. 80 per product A, and Rs. 100 per product B. Formulate LP model for maximizing the profit and show the feasible region graphically. Find the optimal solution.
Ans. 1. The given problem can be formulated as given below :
Max Z = 80 x1 + 100 x2
Subjected to 10 x1 + 7.5 x2 ≤ 75
6x1 + 9x2 ≤ 54
5x1 + 13 x2 ≤ 65
Where x1 represents product A and x2 represents product B.
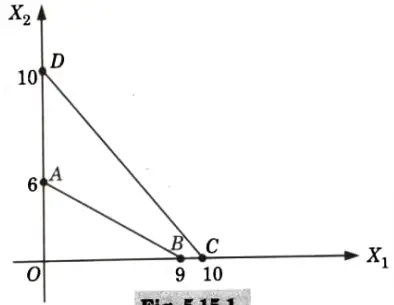
2. On solving the above equations graphically the solution obtained is shown in the Fig.
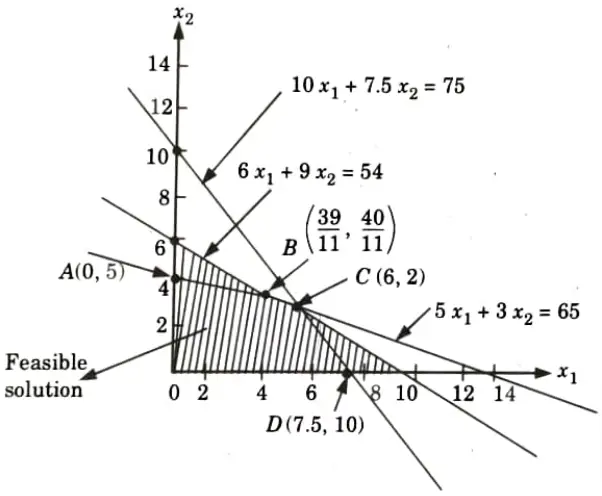
3. The optimal solution of the given problem is at point C i.e., x1 = 6 and x2 = 2.
Max Z = 80 x 6 + 100 + 2
= 480 + 200 = 680
b. Use Vogel’s approximation method to obtain an initial feasible solution of the transportation problem:
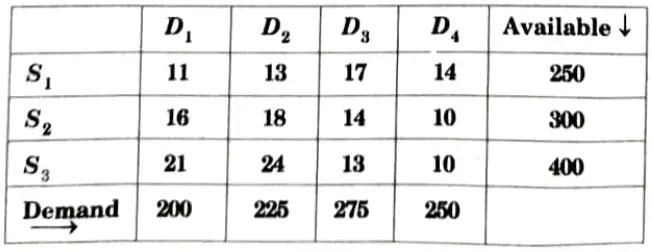
Ans. 1. Following the usual procedure of Vogel’s approximation method, initial feasible solution of the given problem is obtained as given below :
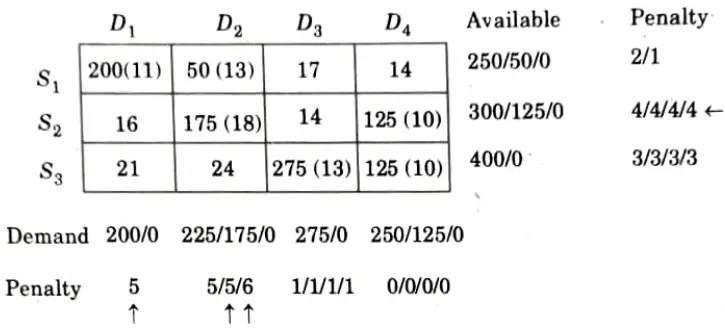
2. Initial basic feasible solution
= 200 x 11 + 50 x 13 + 175 x 18 + 125 x 10 + 275 x 3 + 125 x 10
= Rs 12075
6 thoughts on “Industrial Engineering: Solved Aktu Question Paper Notes pdf”