Prepare for the AKTU B.Tech 2023 Engineering Hydrology examinations! We’ll evaluate your engineering knowledge, problem-solving abilities, and comprehension of concepts. Let’s all work together to ace those exams!
Dudes 🤔.. You want more useful details regarding this subject. Please keep in mind this as well.

Important Questions For Engineering Hydrology:
*Quantum          *B.tech-Syllabus
*Circulars           *B.tech AKTU RESULT
* Btech 3rd Year
Section A, Short Question for Engineering Hydrology
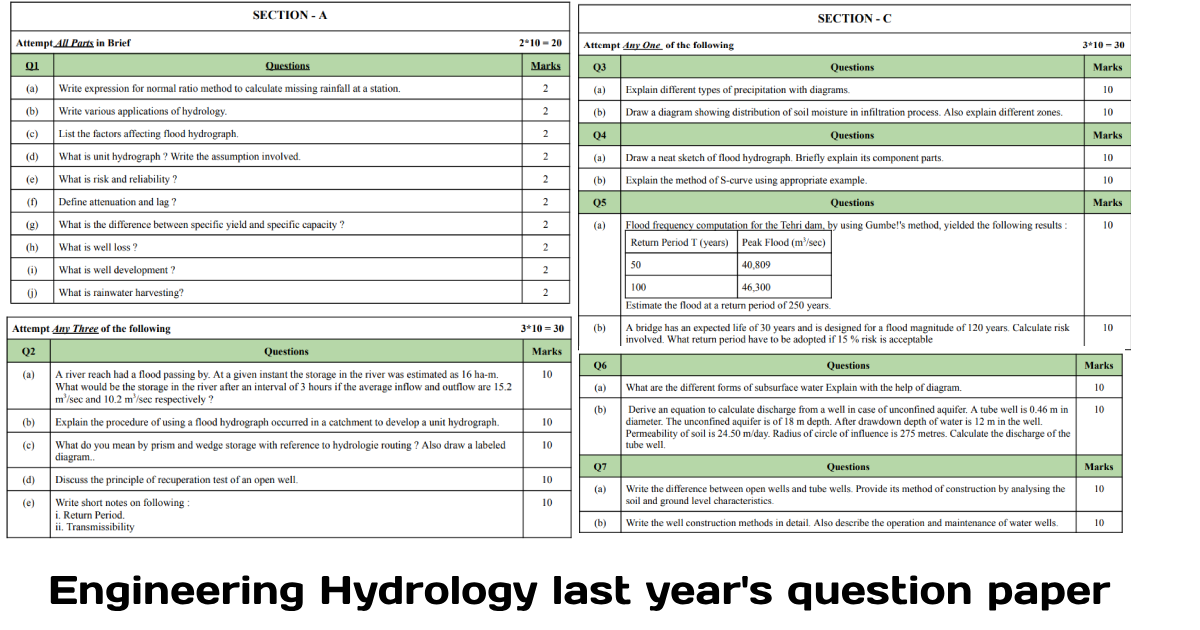
a. Write expression for normal ratio method to calculate missing rainfall at a station.
Ans. In this method, the rainfall (Pi) of the surrounding index stations is weighed by the ratio of normal annual rainfalls by using the following equation:
b. Write various applications of hydrology.
Ans. Applications of Hydrology:
- 1. Designing dams for water supply or hydroelectric power generation.
- 2. Designing sewers and urban drainage system.
- 3. Designing bridges.
- 4. Mitigating and predicting flood, landslide and drought risk.
- 5. Providing drinking water.
- 6. Designing irrigation schemes and managing agricultural productivity.
- 7. Determining the water balance of a region.
c. List the factors affecting flood hydrograph.
Ans. Following are the factors affecting flood hydrograph:
i. Storm Characteristics: Precipitation, intensity, duration, magnitude, and movement of storm.
- ii. Initial loss.
- iii. Evapotranspiration.
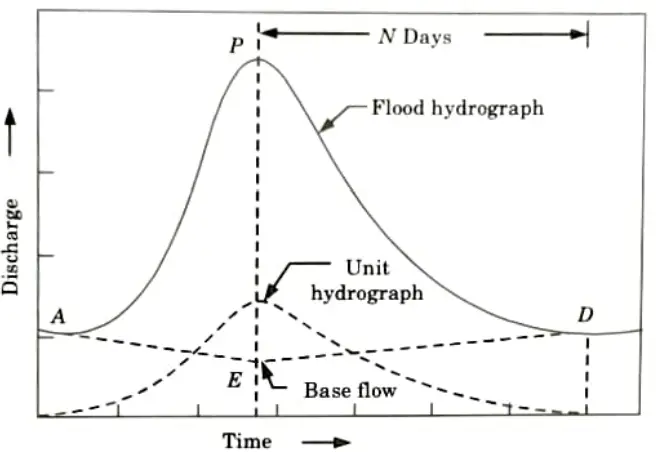
d. What is unit hydrograph ? Write the assumption involved.
Ans. Unit Hydrograph: A unit hydrograph is defined as the hydrograph of direct runoff caused by one unit depth (1 cm) of extra rainfall happening uniformly over the basin and at a uniform rate for a specific duration (D hours). The term unit here refers to a unit depth of rainfall surplus which is commonly taken as 1 cm.
≥ Assumptions: Following are two basic assumptions constitute the foundation for the unit hydrograph theory:
i. The time invariance.
ii. The linear response.
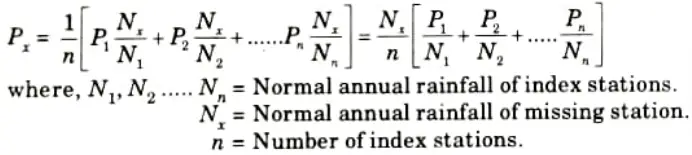
e. What is risk and reliability ?
Ans. Risk: The probability of occurrence of an event (x xT) at least once over a period of n successive years is called the risk, R.
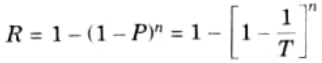
Reliability: The reliability, Re is defined as,
f. Define attenuation and lag ?
Ans. Attenuation: The peak of the outflow hydrograph will be lower than the peak of the inflow hydrograph due to the storing effect. Attenuation refers to the reduction in peak value.
Lag: Also, the outflow peak occurs after the inflow peak; the time gap between the two peaks is known as lag.
g. What is the difference between specific yield and specific capacity ?
Ans. Specific Yield: The specific yield is the actual volume of water that can be recovered by gravity from a unit volume of aquifer material.
Specific Capacity: The discharge per unit drawdown at the well (Q/sw) is known as a well’s specific capacity and is a measure of the well’s performance.
h. What is well loss ?
Ans. When water is pumped out of a well, the total drawdown induced comprises not only the logarithmic drawdown curve at the well face, but also flow through the well screen and axial movement within the well. The latter is referred to as well loss.
i. What is well development ?
Ans. It is the process of removing finer particles from surrounding the screen in order to increase the permeability of the formation, which allows water to migrate towards the well.
j. What is rainwater harvesting ?
Ans. Rainwater harvesting is the practise of collecting rainwater where it falls. It is an excellent strategy for conserving water and increasing water availability for drinking, industrial, or groundwater recharge.
Section B Long Question For Engineering Hydrology
a. A river reach had a flood passing by. At a given instant the storage in the river was estimated as 16 ha-m. What would be the storage in the river after an interval of 3 hours if the average inflow and outflow are 15.2 m3/sec and 10.2 m3/sec respectively ?
Ans. Given: Storage in the river = 10 ha-m, Average inflow = 15.2 m3/sec, Average outflow =10.2 m3/sec, Interval = 3 hr
To Find: Storage in the river.
- 1. Storage in starting, 𝚫S = 16 x 104 m3
- 2. Inflow = 15.2 x 3 x 3600 164160 m3
- 3. Outflow = 10.2 x 3 x 3600 = 110160 m3
- 4. New storage, 𝚫S’ = 𝚫S+ inflow – outflow
- = 16 x 104+ 164160 – 110160 = 214000
- = 21.4 ha-m
b. Explain the procedure of using a flood hydrograph occurred in catchment to develop a unit hydrograph.
Ans. Derivation of Unit Hydrograph: The following are the steps for constructing a unit hydrograph of some unit duration from a storm hydrograph of the same unit duration Fig.
1. Choose a unit period of intense rainfall duration from the past records that corresponds to an isolated storm that is uniformly spread over the area.
2. Using previous river flow information for that storm, create a storm hydrograph for a few days before and after the period of rainfall of that unit duration.
3. Determine the ordinates of direct runoff by subtracting the ordinates of base flow from the total ordinates.
4. Calculate direct runoff n (in centimeters) by the expression:
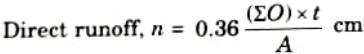
where, 𝚺O = Sum of the discharge ordinates (direct runoff) in cumecs.
t = Time interval between successive ordinates in hours.
A = Area of drainage basin in sq. km.
5. Calculate the ordinates of unit hydrograph by the relation:

c. What do you mean by prism and wedge storage with reference to hydrologie routing ? Also draw a labeled diagram.
Ans. i. Prism Storage: It is the volume generated by an imaginary plane parallel to the channel bottom drawn at the outflow section water surface if uniform flow occurred at the downstream depth.
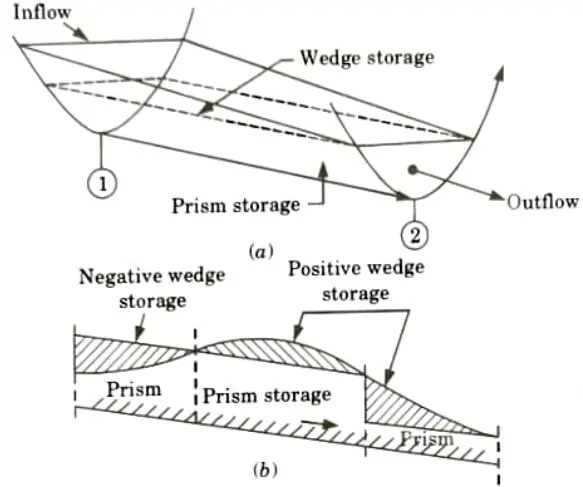
ii. Wedge Storage:
- a. It is the wedge-shaped volume generated between the real water surface profile and the prism storage’s top surface.
- b. At a certain depth in a downstream part of a river reach, the prism storage is constant, whereas the wedge storage varies from positive to negative during an advancing flood.
- c. The prism storage Sp is similar to a reservoir and can be expressed as a function of the outflow discharge, Sp = f(Q).
- d. The wedge storage can be accounted for by expressing it as Sw = f(I).
- e. The total storage in the channel reach can then be expressed as,

where, K and x are coefficients and m = A constant exponent.
- f. It has been found that the value of m varies from 0.6 for rectangular channels to a value of about 1.0 for natural channels.
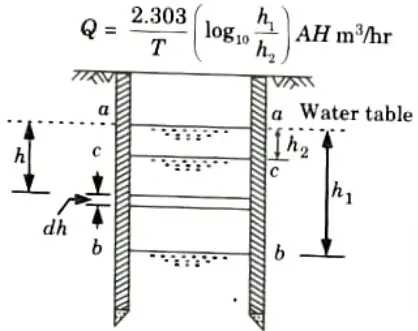
d. Discuss the principle of recuperation test of an open well.
Ans.
- 1. Although the constant level pumping test provides an accurate value of the state yield of an open well, it might be difficult to manage the pump in such a way that the well maintains a constant level.
- 2. In such cases, a recovery test is performed.
- 3. During the recuperation test, the water level is reduced to any level below normal and the pumping is turned off.
- 4. The time taken for the water to recuperate to the normal level is noted. From the data, the discharge from the well can be calculated as:
e. Write short notes on following:
i. Return Period.
ii. Transmissibility.
Ans. i. Return Period:
- 1. The probability of occurrence of an event of random variable (e.g., rainfall) whose magnitude is equal to or in excess of a specified magnitude X is denoted by P.
- 2. The recurrence interval (also known as return period) is defined as:
- T = 1/P
- 3. This represents the average interval between the occurrence of a rainfall of magnitude equal to or greater than X.
- 4. Thus, if it is stated that the return period of rainfall of 20 cm in 24 h is 10 years at a certain station A, it implies that on an average, raintall magnitudes equal to or greater than 20 cm in 24 h occur once in 10 years, i.e., in a long period of say 100 years, 10 such events can be expected.
- 5. However, it does not mean that every 10 years one such event is likely, ie., periodicity is not implied.
ii. Transmissibility:
- 1. Consider an aquifer of unit width and thickness B, (i.e., depth of a fully saturated zone). The discharge through this aquifer under a unit hydraulic gradient is known as transmissibility.
- 2. It expressed as, T = KB
- 3. T has the dimensions of [L2/T].4. Its units are m2/sec or litres per day/metre width (lpd/m).
Section C : Long Question
a. Explain different types of precipitation with diagrams.
Ans. Precipitation: Precipitation is the term used by hydrologists to describe all types of moisture that fall from the clouds.
Types of Precipitation:
1. Cyclonic Precipitation: The lifting of air masses converging into the cyclone’s low pressure area causes cyclonic precipitation. There are two types of cyclonic precipitation: (a) Frontal precipitation and (b) Non-frontal precipitation.
2. Convective Precipitation:
- i. Convective precipitation occurs as a result of the natural rise of warmer, lighter air in colder, denser surroundings.
- ii. The temperature differential could be caused by unequal heating at the surface, unequal cooling at the top of the air layer, or mechanical lifting when air is pushed to pass over denser colder air masses.
- iii. Convective precipitation is sporadic and varies in intensity from light showers to cloud bursts.
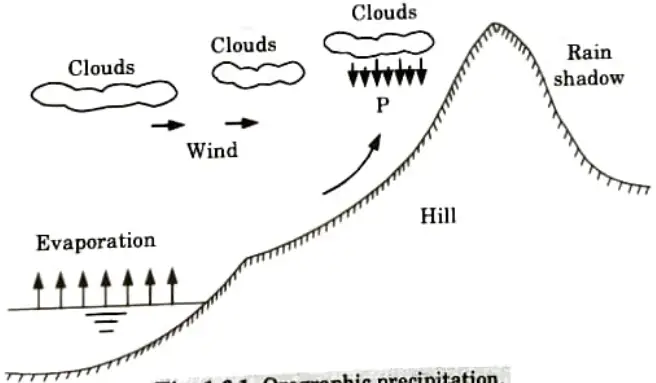
3. Orographic Precipitation:
- i. Orographic precipitation is caused by geographic barriers raising warm moisture-laden air masses (such as mountains).
- ii. As it ascends, it comes into touch with cold air, resulting in precipitation.
- iii. The zone on the other side of the mountain will be a rain shadow area where rainfall may not occur, as indicated in Fig.
- iv. All precipitation in the Himalayan region is due to the orographic ascent of air masses rich in moisture content due to their long journey over seas.
4. Precipitation Due to Turbulent Ascent:
i. After crossing the ocean, the air mass is forced to rise due to increased friction on the earth’s surface.
ii. As a result of increased turbulence and friction, the air mass rises, eventually condensing and precipitating.
b. Draw a diagram showing distribution of soil moisture in infiltration process. Also explain different zones.
Ans. Infiltration: It is the flow of water into the ground through the soil surface.
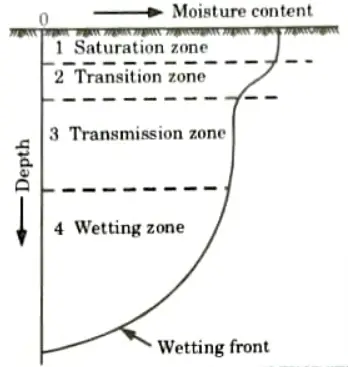
Zone 1: At the top, a thin layer of saturated zone is created.
Zone 2: Beneath zone 1 there is a transition zone.
Zone 3:
- i. The transmission zone is the next lower zone, when moisture moves downward.
- ii. The moisture content in this zone is higher than field capacity but lower than saturation.
- iii. It is further distinguished by unsaturated flow and reasonably homogeneous moisture content.
Zone 4:
- i. The final zone is the wetting zone. The soil moisture content in this zone will be at or near field capacity, and it will decline with depth.
- ii. The wetting front is the boundary of the wetting zone, where there is a sharp discontinuity between the newly wet soil and the original moisture content of the soil.
- iii. The wetting front can range from a few centimeters to meters in length, depending on the quantity of infiltration and the physical qualities of the soil.
Section 4 : Long Question for AKTU last year Question paper
a. Draw a neat sketch of flood hydrograph. Briefly explain its component parts.
Ans. A. Hydrograph: A hydrograph is a plot of a stream’s discharge against time in chronological order.
B. Components of Hydrograph: The essential components of a hydrograph are described below:
1. Rising Limb:
- i. The rising limb of a hydrograph, also known as the concentration curve, depicts the progressive rise in discharge caused by storage accumulation in channels and on the catchment surface.
- ii. The initial losses and significant infiltration losses during the early stages of a storm lead the discharge to rise slowly.
- iii. As the storm progresses, more and more flow from distant regions of the basin reaches the basin outflow.
- iv. Concurrently, infiltration losses reduce with time. As a result, during a uniform storm over the catchment, runoff increases fast over time.
- v. As previously stated, the basin and storm characteristics influence the shape of a hydrograph’s rising limb.
2. Crest Segment:
- i. The crest section, which holds the peak flow, is one of a hydrograph’s most crucial components.
- ii. The catchment’s runoff from various areas contributes to the peak flow. To get the greatest flow at the basin exit, simultaneously donate a certain quantity.
- iii. For large catchments, the peak flow typically occurs after the rain has stopped, with the length of time between the centre of the storm’s downpour and the peak flow largely determined by these factors.
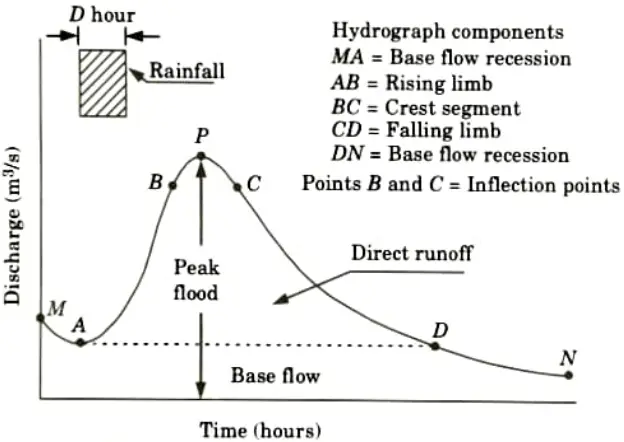
3. Recession Limb:
- i. The withdrawal of water from the storage built up in the basin during the earlier phases of the hydrograph is represented by the recession limb, which runs from the point of inflection at the end of the crest segment (point C in Fig.) to the start of the natural groundwater flow (point D in Fig.).
- ii. The condition of maximum storage is represented by the point of inflection, which is the beginning of the recession limb.
- iii. Because the storage is depleted after the rain stops, the hydrograph’s shape is totally dependent on basin parameters and is unaffected by storm characteristics.
- iv. The storage of water in the basin exists as (i) surface storage, which includes both surface detention and channel storage, (ii) interflow storage, and (iii) groundwater storage, i.e., base-flow storage.
b. Explain the method of S-curve using appropriate example.
Ans. Method of Construction of Unit Hydrograph:
- 1. Ideally, unit hydrographs are derived from simple isolated storms and if the duration of the various storms do not differ very much, say within a band of ± 20 % D, they would all be grouped under one average duration of D-h.
- 2. If unit hydrographs of various durations are required for practical applications, they are best produced from field data.
- 3. For a specific watershed, the creation of unit hydrographs covering a large range of periods is typically impossible due to a lack of sufficient data.
- 4. In these circumstances, unit hydrographs of varying duration nD are developed using a D-hour unit hydrograph.
- 5. Two methods are available for this purpose:
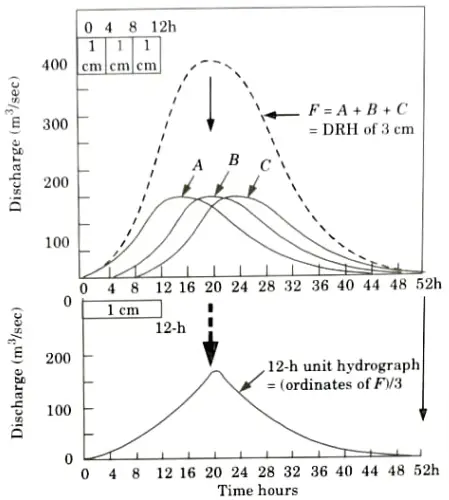
i. Method of Superposition:
- a. If a D-h unit hydrograph is available, and it is desired to develop a unit hydrograph of nD-h, where n is an integer, it is easily accomplished by superposing n unit hydrographs with each graph separated from the previous on by D-h. Fig. shows three 4-h unit hydrographs A, B and C.
- Curve B begins 4 h after A and C begins 4-h, after B.
- b. Thus the combination of these three curves is a DRH of 3 cm due to an excess rainfall (ER) of 12-h duration. If the ordinates of this DRH are now divided by 3, one obtains a 12-h unit hydrograph. The calculations are easy if performed in a tabular form.
ii. The S-curve:
- a. If it is desired to develop a unit hydrograph of duration mD, where m is a fraction, the method of superposition cannot be used.
- b. A different technique known as the S-curve method is adopted in such cases, and this method is applicable for rational values of m.
- c. The S-curve, also known as S-hydrograph is a hydrograph produced by a continuous effective rainfall at a constant rate for an infinite period.
- d. It is a curve obtained by summation of an infinite series of D-h unit hydrographs spaced D-h apart.
- e. Fig. shows such a series of D-h hydrograph arranged with their starting points D-h apart.
- f. At any given time the ordinates of the various curves occurring at that time coordinate are summed up to obtain ordinates of the S-curve.
- g. A smooth curve through these ordinates result in an S-shaped curve called S-curve.
- Unit rainfall excess equals 1 em in D-h
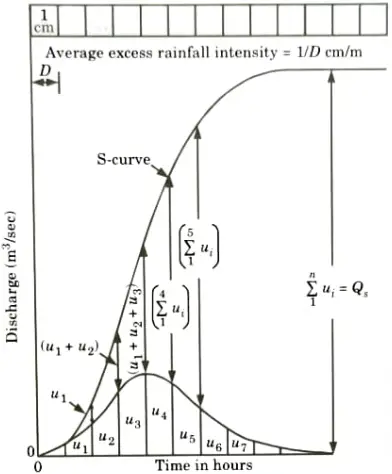
- h. This S-curve is due to a D-h unit hydrograph. It has an initial steep portion and reaches a maximum equilibrium discharge at a time equal to the time base of the first unit hydrograph.
- i. The average intensity of ER producing the S-curve is 1/D cm/h and the equilibrium discharge,
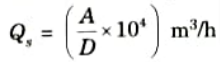
where, A = Area of the catchment in km2, and D = Duration in hours of ER of the unit hydrograph used in deriving the S-curve. Alternatively,
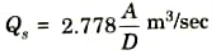
where, A is in the km2, and D is in h.j. The quantity Qs represents the maximum rate at which an ER intensity of 1/D cm/h can drain out of a catchment of area A. In actual construction of an S-curve, it is found that the curve oscillates in the top portion at around the equilibrium value due to magnification and accumulation of small errors in the hydrograph. When it occurs, an average smooth curve is drawn such that it reaches a value Qs at the time base of the unit hydrograph.
Section 5 Long Question for Engineering Hydrology
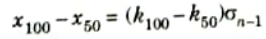
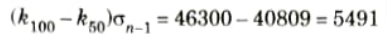
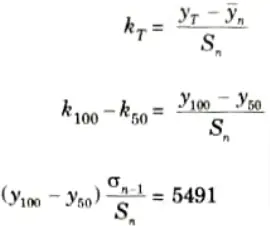
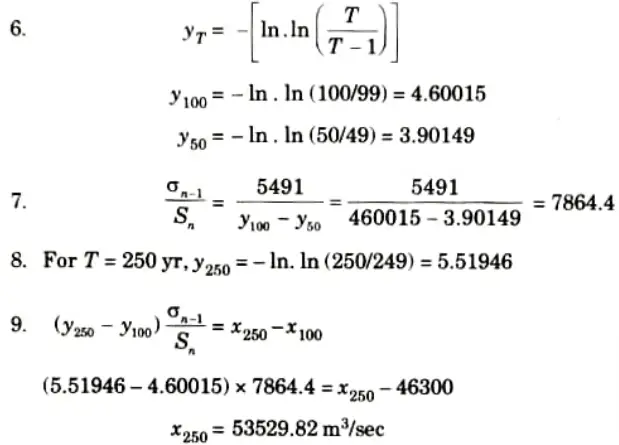
a. Flood frequency computation for the Tehri dam, by using Gumbe!’s method, yielded the following results:
| Return Period T (years) | Peak Flood (m3/sec) |
| 50 | 40,809 |
| 100 | 46,300 |
Estimate the flood at a return period of 250 years.
Ans. Given: Return period, 7 = 250 yr, x100 = 46300 m3/sec, x50 = 40809 m3/sec
To Find: Flood discharge.
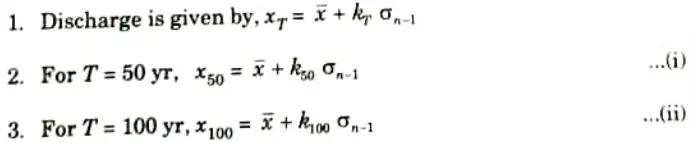
4. From eq. (i) and eq. (ii), we get
5. We know that,
b. Abridge has an expected life of 30 years and is designed for a flood magnitude of 120 years. Calculate risk involved. What return period have to be adopted if 15 % risk is acceptable
Ans. Given: Expected life of bridge, n = 30 yr, Design life of bridge, T = 120 yr
To Find: Return period for 15 % risk
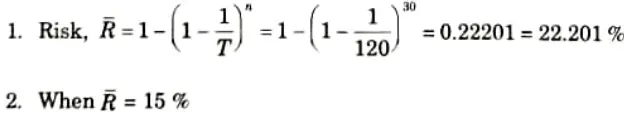
T = 185.094 yr
Section 6 Long Question
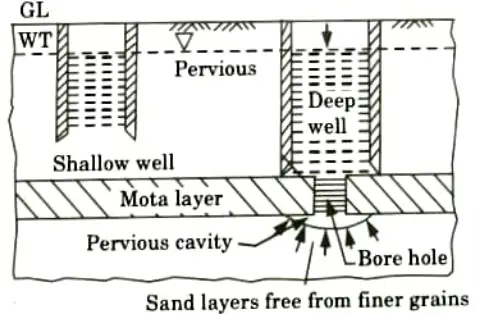
a. What are the different forms of subsurface water Explain with the help of diagram.
Ans. Forms of Subsurface Water: The underground water is generally available in the following forms:
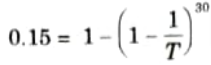
1. Infiltration Galleries:
- i. As illustrated in Fig., they are horizontal or nearly horizontal tunnels dug at shallow depths (3 to 5 metres) along the river’s bank through the strata that contain water. These are referred to as horizontal wells at times.
- ii. These galleries typically have masonry walls and slab roofs, and they get their water from the aquifer through a variety of porous drain pipes.
- iii. To stop fine sand particles from entering the pipe, these pipes are typically coated in gravel.
- iv. These tunnels or galleries are typically built at an angle, and the water that collects in them is sent to a sump well where it is pumped, cleaned, and then given to the users.
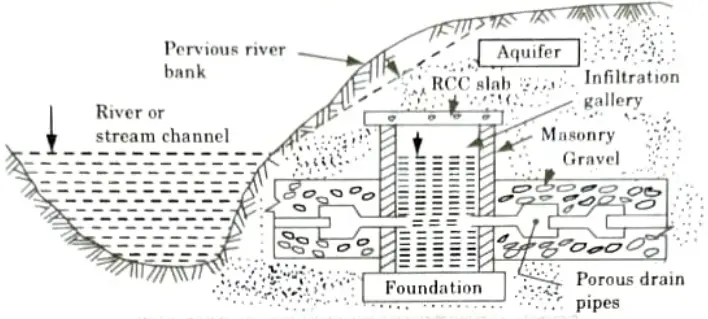
2. Infiltration Wells:
- i. As illustrated in Fig.(a) these are the shallow wells built in a series along the borders of rivers to catch river water seeping through their bottoms .
- ii. As seen in Fig.(b) these wells are often made of brick masonry with open joints, covered at the top, and left open at the bottom. Manholes are included in the top cover for inspection needs.
iii. According to Fig.(c) the different infiltration wells are linked to a jack well, a sump well, by porous pipes. Water from several infiltration wells that reaches the jack well is hoisted, processed, and given to the users.
3. Springs: A spring is considered to be formed when groundwater naturally emerges at the surface of the planet. Natural springs are created by a permeable layer wedged between two impermeable layers.
Types of Springs:
i. Gravity Springs: A gravity spring is created when the groundwater table rises significantly and the water overflows over the sides of a natural valley or depression.
ii. Surface Springs: The water table can rise and become exposed to the ground surface when an impermeable obstacle or layer that supports underground storage becomes sloped. Surface springs are this kind of spring.
iii. Artesian Springs: The spring that forms when the storage is put under pressure (i.e., when the water is moving through a small aquifer) is referred to as an artesian spring. These kinds of springs are also used to supply water in nearly consistent quantities.
4. Wells: A water well is an earthen excavation that is often vertical and is used to bring groundwater to the surface for drinking.
The wells may be classified into two types:
i. Open Wells:
a. They are typically open masonry wells with relatively larger diameters that can handle low discharges of 1 to 5 litres per second.
b. Open wells typically range in diameter from 2 to 9 m and have a depth of less than 20 m.
c. Precast concrete rings, brick, or stone masonry are both acceptable materials for an open well’s walls.
Type of Open Wells: The open wells may be classified into the following two types:
- a. Shallow open wells.
- b. Deep open wells.
ii. Tube Wells:
- a. An open well’s discharge is typically restricted to 3 to 6 liters/sec.
- b. It is not cost-effective to mechanically pump the modest discharges found in open wells.
- c. A tube well, which is a long conduit or tube that is drilled or bored far into the earth to intercept one or more water-bearing strata, is used to mechanically produce enormous discharges.
Types of Tubewells: The tubewells can be broadly classified into the following two categories:
a. Cavity type tubewells.
b. Screen tubewells.
b. Derive an equation to calculate discharge from a well in case of unconfined aquifer. A tube well is 0.46 m in diameter. The unconfined aquifer is of 18 m depth. After drawdown depth of water is 12 m in the well. Permeability of soil is 24.50 m/day. Radius of circle of influence is 275 meters. Calculate the discharge of the tube well.
Ans. Given: Diameter of well d, = 0.46 m, Depth of aquifer, H = 18 Permeability of soil, k = 24.5 m/day, Radius of influence circle, R= 275 m
To Find: Discharge of tube well.
1. Drawdown of well, s = 18 – 12 = 6 m

3. Discharge from unconfined aquifer is given by,
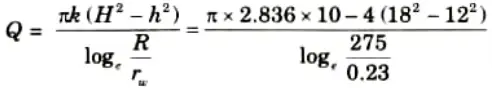
= 0.022654 m3/sec
Q = 22.654 lit/sec
Section 7 : Long Question
a. Write the difference between open wells and tube wells. Provide its method of construction by analyzing the soil and ground level characteristics.
Ans. A. Difference:
| S.No. | Open Well | Tube Well |
| 1. | They are typically open masonry wells that are appropriate for low discharges and have relatively larger diameters. | A tube well, which is a long conduit or tube, is drilled or bored far into the earth to intercept one or more strata that are rich in water. |
| 2. | Open well generally discharges 1-5 lit/sec. | Tube well generally discharges 3-6 lit/sec. |
| 3. | The diameter of open wells generally varies from 2 to 9 m, and they are generally less than 20 m in depth. | Tube well have mainly diameter of 0.5-0.56 m. |
B. Methods:
| S. No. | Open Well Construction Method | Soil Characteristics | Ground Level Characteristics |
| 1. | Augering | Clay, silt, sand, gravel less than 2 cm | Loose soil |
| 2. | Driving (hand, air hammer) | Silt, sand, gravel less than 5 cm | Loose soil |
| 3. | Jetting (light, Portable rig) | Silt, sand, gravel less than 2 cm | Loose soil |
| 4. | Drilling | Unconsolidated and consolidated medium hard and hard rocks | Stony and hard |
| S. No. | Tube Well Construction Method | Soil Characteristics | Ground Level Characteristics |
| 1. | Wash boring method | Gravel, sand, clay or other soft deposits | Loose soil |
| 2. | Cable tool method | Consolidated rock materials | Stony and hard |
| 3. | Hydraulic rotary method | Unconsolidated strata | Stony and hard |
b. Write the well construction methods in detail. Also describe the operation and maintenance of water wells.
Ans. A. Well Construction: Drilling, installing the casing, installing a well screen and filter pack, if necessary, grouting to offer sanitary protection, and developing the well to ensure sand-free operation at maximum yield are the four or five main processes that typically make up a well building project.
1. Drilling Methods:
- i. Wells can be drilled, driven, driven, bored, driven, or jetted. In good drilling circumstances, it is possible to build shallow wells up to 25 cm in diameter and 45 m deep using straightforward drilling techniques including drive point, jetting, and hand boring.
- ii. The hydrogeology of the formation, the diameter and depth of the production well, the availability of funds, maintenance, and spare parts, as well as the production capacity, volume of work, operational crew, and ease of movement of the rig, all influence the choice of drilling equipment.
2. Installation of Well Screen: The common methods adopted in the case of naturally developed wells are given in the following:
- i. Pull back method.
- ii. Open hole method.
- iii. Baildown method.
- iv. Washdown method.
B. Well Maintenance:
- 1. While the design, building, development, and operation of a well determine its estimated service life, effective maintenance can help the well perform better and last longer.
- 2. Adequate logs of power usage, well drawdown, discharge, and operating hours. Regular water chemistry testing and other such observations will aid in creating appropriate maintenance practises.
- 3. The precipitation of calcium carbonate and iron deposits near the screen is caused by the abrupt pressure decrease and increase in entrance velocity caused by high pumping rates.
- 4. Iron and manganese hydroxides precipitate as a result of the shift in entrance velocities.
- 5. When oxygen is present in the well, soluble ferrous iron might turn into insoluble ferric hydroxide. The interesting deposits can be removed from the holes by adding hydrochloric (muriatic) acid or calgon, followed by agitation and surging.
- 6. The amount of acid typically needed for a single treatment is 1.5 to 2 times the amount of water in the screen.
- 7. Sulfuric acid can also be used in place of hydrochloric acid, although it has a somewhat slower reaction and needs more time to contact the well’s surface.
- 8. The incrustation of tiny silt and clay particles near the screen may cause the yield of the well to drop. Using a dispersing agent, such as polyphosphates, can get rid of this. Every 1000 litres of water in the well needs to have 15 to 30 kilogramme of polyphosphate added for treatment to be effective.
- 9. To make it easier to remove iron bacteria and their slimes and to disinfect the well water, 1 kg of calcium hypochlorite should be added for every 1000 litres of water.
- 10. After adding the polyphosphate and hypochlorite solution to the well, the water is stirred up using a surge plunger or the jetting technique. For best results, the well may need to be treated two or three times.
- 11. Algae or bacterial growths may block the holes. Wells treated with chlorine instead of acid have been shown to be more successful at removing bacterial growths and slime deposits that frequently accompany the buildup of iron oxide.
- 12. The procedure is called as “shock treatment with chlorine” since it calls for a very high concentration of 100 to 200 lpm of accessible chlorine.
- 13. It is crucial to discover and correct any issues with a well’s construction right away, including bad casing connections, incorrect perforations or screens, flawed gravel packs, and improperly seated valves. The well must be completely replaced if a casing pipe or strainer suddenly fails, allowing sand to enter
6 thoughts on “Engineering Hydrology last year’s question paper with Answer AKTU Btech 2023”