
Boost your Aktu Btech Power System-I preparation with these crucial, recurrent questions from Quantum Notes. Improve your understanding and pass your tests! Unit-5 Project Cost Management
Dudes 🤔.. You want more useful details regarding this subject. Please keep in mind this as well.

Important Questions For Quantity Estimation and Construction Management:
*Quantum              *B.tech-Syllabus
*Circulars               *B.tech AKTU RESULT
* Btech 3rd Year    * Aktu Solved Question Paper
Q1. What is cost planning ? Give its advantages and disadvantages.
Ans. Cost Planning:
- 1. Based on the unit cost of the resources and the overall amount of resources needed, the estimate to finish each of these can be created after the resource requirement is known. Cost planning is the name of the procedure, which is essential for managing project costs.
- 2. The project timeline and estimates are crucial elements of a cost strategy.
Advantages of Cost Planning:
- 1. The tender amount will probably be more accurate than the estimate based on the cost plan.
- 2. Reduced chance that the design will be changed.
- 3. Assure that the design is cost-effective and economical.
- 4. Ensure that expenditures are distributed fairly. The result would be a design that is more logical.
Disadvantages of Cost Planning:
- 1. Time consuming to prepare.
- 2. Insufficient information. Architect has not firmed up on the specifications.
- 3. Architect has to draw more details and make design decisions earlier to prepare the cost plan.
Q2. Illustrate the relationship between ‘time’ and ‘cost’.
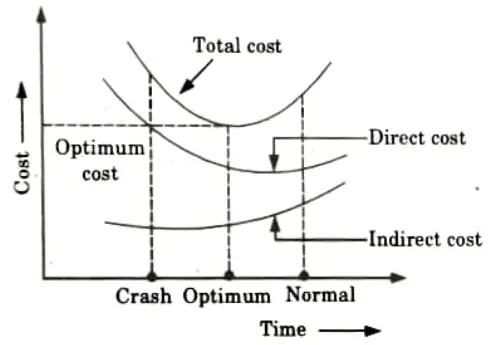
Ans. Total Cost: The direct cost and indirect cost added together constitute the total project cost.
- 1. The indirect cost curve, direct cost curve, and equivalent total cost curve are displayed in Fig.
- 2. Based on the total cost curve, we discover that the optimum duration is the one at which the smallest total cost (also known as the optimum cost) is reached. The minimum cost is the comparable expense.
- 3. The total cost of the project will increase as its duration does.
- 4. In figure we observe two types of times-normal and crash. These will have two types of cost associated with them. These are defined as follows:
- i. Normal Time (tn): It is the standard time that an estimator would usually allow for an activity.
- ii. Crash Time (tc): It is the shortest amount of time that an activity can be finished while still utilising further resources. Crash time is the period of time after which the activity cannot be sped up by any resource increase.
- iii. Normal Cost (Cn): This is the direct cost required for the completion of the activity in the normal time duration.
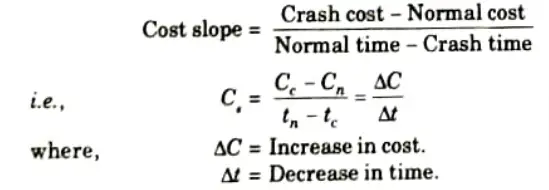
- iv. Crash Cost (Cc): It is the direct cost corresponding to the completion of the activity within crash time.
- v. Cost Slope (Cs): The cost slope is the slope of the direct cost curve, approximated as straight line. The cost slope is defined as follows:
Q3. Bring out the scope of engineering economics with appropriate examples. Explain the process of material selection in new product development.
Ans. 1. Scope of Engineering Economics: Following are the scope of economics in engineering:
- i. It has wide scope in manufacturing, construction, mining and other engineering industries. Examples of economic applications are as follows:
- a. Selection of location and site for a new plant.
- b. Production planning and control.
- c. Selection of equipment and their replacement analysis.
- d. Selection of a material handling system.
- ii. Better decision making on the part of engineers.
- iii. Efficient use of resources results in better output and economic advancement.
- iv. Cost of production can be reduced.
- v. Alternative courses of action using economic principles may result in reduction of prices of goods and services.
- vi. Elimination of waste can result in application of engineering economics.
- vii. Competitive strength on the part of the firm in adopting engineering economics.
- viii. More capital will be made available for investment and growth.
- ix. Improves the standard of living with the result of better products, more wages and salaries, more output, etc. from the firm applying engineering economics.
2. Material Selection in New Product Development:
Following are the steps used in material selection:
- Step 1: Identify the Design Requirements: The possibility of discovering whether prospective materials exist increases when as many requirements as possible are identified. Finding a group of viable materials becomes less likely as the number of requirements rises.
- Step 2: Identify Materials Selection Criteria: Certain material characteristics that result from the needs found in Step 1 are used as the selection criteria for materials. The minimal yield stress necessary for the component’s material, for instance, can be computed for a component that must support a specific load. This will be one of the criteria used to choose the materials.
- Step 3: Identify Candidate Materials: Use the materials selection criteria to rule out materials that will not satisfy all the materials selection criteria.
- Step 4: Evaluate Candidate Materials materials: Candidates may not meet certain selection criteria if there is insufficient information available to determine whether they do or do not. To ascertain whether these materials actually match the selection criteria, they will have been examined and tested.
- Step 5: Select Materials: Select the materials that satisfy materials all the selection criteria at the lowest cost.
Q4. Discuss briefly about cash flow forecasting.
Ans.
- 1. A basic planning element of financial management inside a firm, cash flow forecasting is the process of producing an estimate or projection of a company’s future financial status.
- 2. Based on expected payments and receivables, a cash flow forecast projects the future financial situation of a firm. Cash flow forecasting is the process of creating a cash flow projection.
Goals of Cash Flow Forecasting:
- 1. Improving working capital management is the major objective of cash flow forecasting, which also aims to help manage liquidity within an organisation and ensure that the company has enough cash on hand to meet its obligations and prevent funding problems.
- 2. In addition to the overarching objective of managing liquidity, businesses may establish a cash flow forecasting strategy for a variety of reasons, such as:
- i. Covenant forecasting and half/ full year reporting visibility.
- ii. Interest and debt reduction.
- iii. Short term liquidity planning.
- iv. Long term planning/ budgeting purposes (e.g. 3 year plan)
Q5. What is break even chart ? What are the functions and limitations of break even chart?
Ans. A. Break Even Chart:
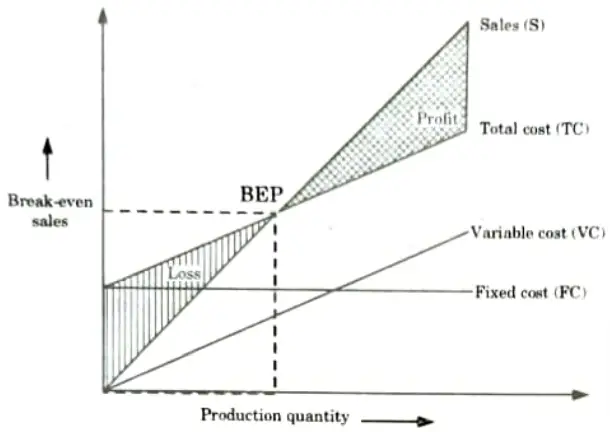
- i. A break-even chart illustrates the relationship between costs and revenues for all potential output quantities.
- ii. The primary goal of the graphic tool is to calculate the break-even point and profit potential under a variety of output and cost conditions.
- iii. It can be referred to as a continuous income (profit and loss) statement in brief.
Therefore, the Concept of Break Even Point ia an follows:
- 1. Profit when Revenue > Total Variable cost + Total Fixed cost
- 2. Break-even point when Revenue = Total Variable cost + Total Fixed cost
- 3. Loss when Revenue < Total Variable cost + Total Fixed cost
B. Functions of Break Even Chart: The various functions of break even chart are as follows :
- 1. It is a crucial instrument for corporate management and provides a comprehensive picture of a company’s situation.
- 2. The BEP of the chart plainly indicates a situation in which there is neither a profit nor a loss.
- 3. It helps to understand how changes in revenue, fixed costs, and variable costs affect a company’s profitability. Hence, it is employed to illustrate the effects of suggested adjustments to operational policy.
- 4. Angle of incidence and margin of safety indicates the business position whether favourable or unfavourable.
- 5. It indicates likely profit or losses at various output levels.
- 6. It is a decision making tool in the hands of management.
C. Limitations of Break Even Chart:
- i. Because it is difficult to categorize costs as fixed or variable when the market conditions are likely to change over the expected capacity range, the BEP might not accurately reflect the situation.
- ii. A tool for a short run study is the break even chart.
- iii. There is no requirement that the total cost line the sum of variable and fixed costs be straight. Costs don’t actually vary in direct proportion in real life.
- iv. Moreover, the revenue line could not be a straight line.
- v. It portrays a static image whereas company operations are highly dynamic.
- vi. When a corporation provides a wide range of products, break even chart analysis becomes more challenging.
Q6. An engineer has two bids for an elevator to be installed in a new building. The details of the bids for the elevators are as follows:
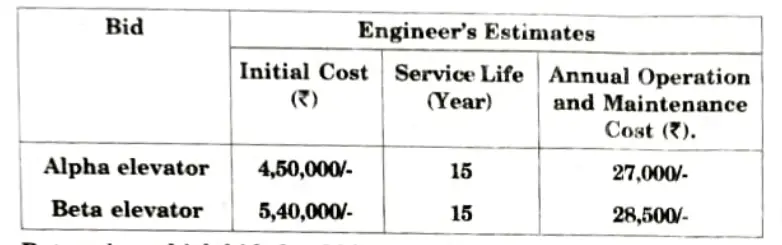
Determine which bid should be accepted, based on method present worth of comparison assuming 15 % interest rate compound annually.
Ans. Given: Table , Rate of interest, n= 15 %
To Find: Acceptable bid by present worth method.
1. Alpha Elevator:
i. Life of this technology, n = 15 years.
Life cash flow diagram of this technology is shown in Fig.
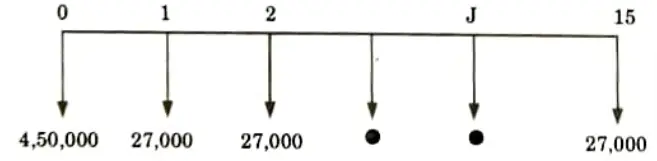
ii. The present worth expression for this technology is
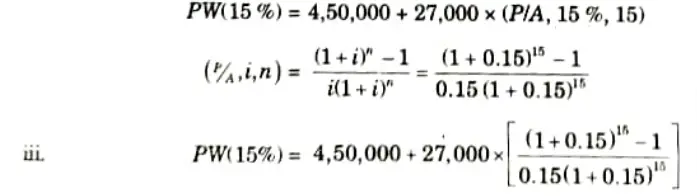
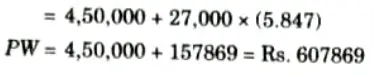
2. Beta Elevator:
i. The cash flow diagram of this technology is shown in Fig.
ii. The present worth expression for this technology is
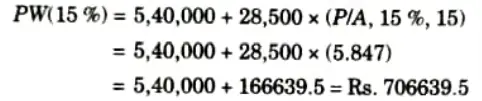
3. Present worth of B bid > Present worth of the A bid.
4. Beta elevator bids are more acceptable than the alpha elevator.

Quantity Estimation and Construction Management Btech Quantum PDF, Syllabus
| Label | Link |
|---|---|
| Subject Syllabus | Syllabus |
| Short Questions | Short-question |
| Question paper – 2021-22 | 2021-22 |
Quantity Estimation and Construction Management Quantum PDF | AKTU Quantum PDF:
| Quantum Series | Links |
| Quantum -2022-23 | 2022-23 |
AKTU Important Links | Btech Syllabus
| Link Name | Links |
|---|---|
| Btech AKTU Circulars | Links |
| Btech AKTU Syllabus | Links |
| Btech AKTU Student Dashboard | Student Dashboard |
| AKTU RESULT (One VIew) | Student Result |