
B.Tech AKTU Quantum Book will take you deep into the field of Data Analytics. To flourish in this dynamic sector, access important notes, repeated questions, and helpful insights. Unit-5 Frame Works and Visualization
Dudes 🤔.. You want more useful details regarding this subject. Please keep in mind this as well.

Important Questions For Data Analytics:
*Quantum              *B.tech-Syllabus
*Circulars               *B.tech AKTU RESULT
* Btech 3rd Year    * Aktu Solved Question Paper
Q1. Write short note on Hadoop and also write its advantages.
Ans. 1. Hadoop is an open-source software framework designed for the development of scalable, dependable, and distributed applications that process massive amounts of data.
2. It is an open-source distributed, batch processing, fault tolerance system that can store massive amounts of data while also processing the same amount of data.
Advantages of Hadoop:
- 1. Fast:
- a. In HDFS (Hadoop Distributed File System), data is dispersed across the cluster and mapped, allowing for faster retrieval.
- b. Even the tools used to process the data are frequently hosted on the same servers, decreasing processing time.
- 2. Scalable: Hadoop cluster can be extended by just adding nodes in the cluster.
- 3. Cost effective: Hadoop is open source and uses commodity technology to store data, making it significantly less expensive than traditional relational database management systems.
- 4. Resilient to failure: HDFS has the ability to duplicate data across networks, so if one node fails or there is another network failure, hadoop will use the other copy of the data.
- 5. Flexible:
- a. Hadoop allows businesses to readily access new data sources and tap into various sorts of data in order to derive value from that data.
- b. It aids in the extraction of useful business insights from data sources such as social media, email discussions, data warehousing, fraud detection, and market campaign analysis.
Q2. Draw and discuss the architecture of Hive in detail.
Ans. Hive architecture: The following architecture explains the flow of submission of query into Hive.
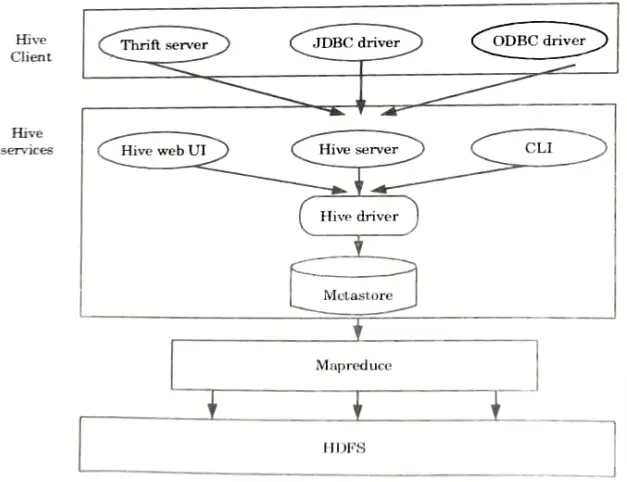
Hive client: Hive allows writing applications in various languages, including Java, Python, and C++. It supports different types of clients such as :
- 1. Thrift Server: It is a platform for cross-language service providers that serves requests from any programming languages that implement Thrift.
- 2. JDBC Driver: It is used to connect Java applications and Hive applications. “The class org.apache.hadoop.hive.jdbe.HiveDriver contains the JDBC Driver.
- 3. ODBC Driver: It allows the applications that support the ODBC protocol to connect to Hive.
Hive services: The following are the services provided by Hive:
- 1. Hive CLI: The Hive CLI (Command Line Interface) is a command shell from which we can run Hive queries and commands.
- 2. Hive Web User Interface: Hive Web UI is a replacement for Hive CLI. It provides a web-based interface for running Hive queries and commands.
- 3. Hive MetaStore:
- a. It is a central repository that maintains all of the warehouse’s structure information for various tables and partitions.
- b. It also provides column and type metadata that is needed to read and write data, as well as the related HDFS files where the data is kept.
- 4. Hive server:
- a. It is referred to as Apache Thrift Server.
- b. It accepts the request from different clients and provides it to Hive Driver.
- 5. Hive driver:
- a. It receives queries from a variety of sources, including the web UI, CLI, Thrift, and JDBC/ODBC driver.
- b. It sends the requests to the compiler.
- 6. Hive compiler:
- a. The compiler’s job is to parse the query and perform semantic analysis on the various query blocks and expressions.
- b. It converts HiveQL statements into MapReduce jobs.
- 7. Hive execution engine:
- a. The optimizer creates a logical plan in the form of a DAG of MapReduce and HDFS tasks.
- b. Finally, the execution engine executes the incoming tasks in the order in which they are dependent.
Q3. Write the features of HBase.
Ans. Features of HBase:
- 1. It is both linearly and modularly scalable across several nodes because it is spread across multiple nodes.
- 2. HBase provides consistent read and write performance.
- 3. It enables atomic read and write, which implies that while one process is reading or writing, all other processes are blocked from completing any read or write actions.
- 4. It offers a simple Java API for client access.
- 5. It offers Thrift and REST APIs for non-Java front ends, with options for XML, Protobuf, and binary data encoding.
- 6. It has a Block Cache and Bloom Filters for real-time query optimisation as well as large volume query optimisation.
- 7. HBase supports automatic failover across region servers.
- 8. It supports exporting measurements to files using the Hadoop metrics subsystem.
- 9. It does not enforce data relationships.
- 10. It is a data storage and retrieval platform with random access.
Q4. Write short note on R programming language with its features.
Ans.
- a. R language is a programming language that is combined with packages.
- b. It is used to process and visualize data.
- c. It is a multi-functional language that allows for data manipulation, calculation, and display.
- d. It can store the figures and execute computations on them with the goal of assembling an ideal set.
- e. It provides the following features to assist data operations:
- 1. R includes data-handling functions such as declaration and definition, and it also enables in-memory data storage.
- 2. It allows data gathering procedures such as set and matrix.
- 3. There are numerous tools available for data analysis in R.
- 4. R-generated visual representations can be printed as well as displayed on the screen.
- 5. The ‘S’ programming language is accessible online to help simplify R’s functions.
- 6. A large number of packages for various data processing functions in the R language are available in the repository.
- 7. R has a graphical illustration function for data analysis that may be exported to external files in a variety of formats.
- 8. R can meet data analytics requirements from start to finish. It can be used to generate any analysis quickly.
Q5. Explain different interaction techniques.
Ans. 1. Interaction approaches enable the data analyst to interact with the visuals and dynamically adjust them based on the exploration objectives.
2. They also enable the linking and combining of multiple independent visualizations.
Different interaction techniques are:
a. Dynamic projection:
- 1. Dynamic projection is a type of automated navigation.
- 2. The core idea is to change the projections dynamically in order to study a multi-dimensional data set.
- 3. The GrandTour system, which attempts to display all interesting two-dimensional projections of a multidimensional data set as a series of scatter plots, is a well-known example.
- 4. The sequence of projections shown can be random, manual, pre computed, or data driven.
- 5. Examples of dynamic projection techniques include X Gobi XLispStat, and ExplorN.
b. Interactive filtering:
- 1. Interactive filtering combines selection with view enhancement.
- 2. While exploring huge data sets, it is critical to partition the data set interactively into segments and focus on interesting subsets.
- 3. This can be accomplished through either a direct selection of the desired subset (browsing) or by specifying the desired subset’s attributes (querying).
- 4. The Magic Lens is an example of a tool that can be used for interactive filtering.
- 5. The core idea behind Magic Lens is to filter data directly in the visualization using a tool comparable to a magnifying glass. The filter processes the data under the magnifying glass and displays it differently than the rest of the data set.
- 6. Magic Lens changes the view of the specified location while leaving the rest of the display alone.
- 7. Examples of interactive filtering techniques includes InfoCrystal Dynamic Queries, and Polaris.
c. Zooming:
- 1. Zooming is a frequently utilized visual modification method in a variety of applications.
- 2. When dealing with vast volumes of data, it is critical to show the data in a highly compressed form to provide an overview of the data while also allowing for varied display at different resolutions.
- 3. Zooming means not only making the data objects larger, but also changing the data representation to provide more details at higher zoom levels.
- 4. The items can be displayed as single pixels at a low zoom level, icons at an intermediate zoom level, and named objects at a high resolution, for example.
- 5. The TableLens approach is an intriguing example of applying the zooming concept to huge tabular data sets.
- 6. TableLens’ core concept is to display each numerical value with a tiny bar.
- 7. The lengths of all bars are controlled by the attribute values and have a one-pixel height.
- 8. Examples of zooming techniques includes PAD++, IVEE/Spotfire, and DataSpace.
d. Brushing and Linking:
- 1. Brushing is an interactive selection procedure that communicates the selected data to other views of the data set.
- 2. The concept of linking and brushing is to integrate several visualization methods in order to overcome the inadequacies of individual techniques.
- 3. Linking and brushing can be applied to visualizations generated by different visualization approaches. As a result, the brushing points are highlighted in all representations, allowing dependencies and correlations to be identified.
- 4. Changes made interactively in one visualization are automatically reflected in the others.
Distortion:
- 1. Distortion is a visual modification technique that aids in data exploration by maintaining an overview of the data during drill-down activities.
- 2. The main idea is to display some of the data in high detail while others are displayed in low detail.
- 3. Hyperbolic and spherical distortions are popular distortion techniques.
- 4. They are commonly employed on hierarchies and graphs, but they can be used to any other type of visualization technique.
- 5. Examples of distortion techniques include Bifocal Displays, Perspective Wall, Graphical Fisheye Views, Hyperbole Visualization, and Hyperbox.
Q6. Differentiate between MapReduce and Apache Pig.
Ans.
| S. No. | MapReduce | Apache Pig |
| 1. | It is a low-level data processing tool. | It is a high-level data flow tool. |
| 2. | Here, it is required to develop complex programs using Java or Python. | It is not required to develop complex programs. |
| 3. | It is difficult to perform data operations in MapReduce. | It has built-in operators for performing data operations such as union, sorting, and ordering. |
| 4. | It does not allow nested data types. | It provides nested data types like tuple, bag, and map. |

Data Analytics Btech Quantum PDF, Syllabus, Important Questions
| Label | Link |
|---|---|
| Subject Syllabus | Syllabus |
| Short Questions | Short-question |
| Question paper – 2021-22 | 2021-22 |
Data Analytics Quantum PDF | AKTU Quantum PDF:
| Quantum Series | Links |
| Quantum -2022-23 | 2022-23 |
AKTU Important Links | Btech Syllabus
| Link Name | Links |
|---|---|
| Btech AKTU Circulars | Links |
| Btech AKTU Syllabus | Links |
| Btech AKTU Student Dashboard | Student Dashboard |
| AKTU RESULT (One VIew) | Student Result |