
Dive into the field of Data Analytics with the B.Tech AKTU Quantum Book. Access crucial notes, frequently asked questions, and valuable insights to flourish in this dynamic sector. Unit-1 Introduction to Data Analytics
Dudes 🤔.. You want more useful details regarding this subject. Please keep in mind this as well.

Important Questions For Data Analytics:
*Quantum              *B.tech-Syllabus
*Circulars               *B.tech AKTU RESULT
* Btech 3rd Year    * Aktu Solved Question Paper
Q1. Explain the source of data (or Big Data).
Ans. Three primary sources of Big Data are:
- 1. Social data:
- a. Social data is derived from likes, tweets and retweets, comments, video uploads, and general media posted and shared through social media networks.
- b. This type of data provides essential insights into consumer behaviour and sentiment, and it can have a huge impact on marketing analytics.
- c. Another good source of social data is the public web, and tools like Google Trends can be used effectively to expand the volume of big data.
- 2. Machine data:
- a. Machine data is information created by industrial equipment, sensors put in machinery, or even online logs that track user behaviour.
- b. As the internet of things becomes more prevalent and spreads over the world, this type of data is predicted to grow tremendously.
- c. In the very near future, sensors such as medical devices, smart metres, road cameras, satellites, games, and the quickly expanding Internet of Things will give high velocity, value, volume, and variety of data.
- 3. Transactional data:
- a. Transactional data is generated by all daily transactions, whether online and offline.
- b. Transactional data includes invoices, payment orders, storage records, and delivery receipts.
Q2. Explain the characteristics of Big Data.
Ans. Big Data is characterized into four dimensions:
- 1. Volume:
- a. Volume is concerned with the magnitude of data, i.e., the rate at which data is growing.
- b. The volume of data is rapidly increasing as a result of various corporate, social, web, and scientific uses.
- 2. Velocity:
- a. As data speeds up, analysis of streaming data becomes more important.
- b. The velocity is related to the increasing speed of business intelligence applications such as trading, telecom and banking transactions, the growing number of internet connections with greater internet usage, and so on.
- 3. Variety: It represents several types of data for analysis, such as structured, semi-structured, and unstructured data.
- 4. Veracity:
- a. Veracity is concerned with data uncertainty or inaccuracy.
- b. Because data is often erroneous, screening and picking the data that is actually required is a difficult undertaking.
- c. A significant amount of statistical and analytical work must be performed in order to select intrinsic facts for decision making.
Q3. Write short note on evolution of analytics scalability.
Ans. 1. In order to achieve analytic scalability, we must first collect the data in a separate analytics environment and then begin analyzing it.
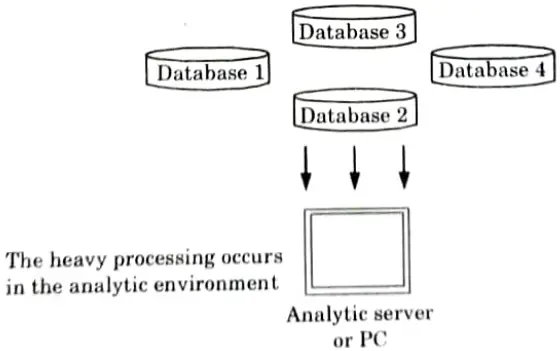
- 2. Analysts perform the merging process on data sets that include rows and columns.
- 3. The columns contain client information such as name, spending level, and status.
- 4. A merge or join is the combination of two or more data sets. They are usually merged / linked in such a way that certain rows from one data set or table are mixed with specified rows from another.
- 5. Analysts also prepare data. Joins, aggregations, derivations, and transformations are components of data preparation. Throughout this procedure, they collect data from multiple sources and combine it to create the variables needed for an analysis.
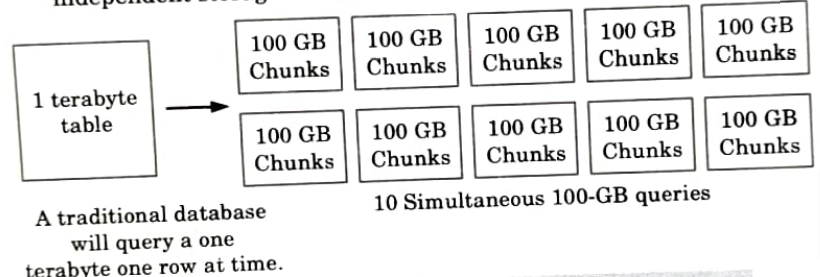
- 6. The most mature, established, and widely deployed mechanism for storing and analyzing vast volumes of data is the massively parallel processing (MPP) system.
- 7. An MPP database divides data into independent parts that are maintained by separate storage and central processing unit (CPU) resources.
- 8. MPP systems build in redundancy to make recovery easy.
- 9. MPP systems have resource management tools:
- a. Manage the CPU and disk space
- b. Query optimizer
Q4. Explain the application of data analytics.
Ans. Application of data analytics:
- 1. Security: Data analytics technologies, notably predictive analysis, have also aided in the reduction of crime rates in certain places.
- 2. Transportation:
- a. Data analytics has the potential to transform transportation.
- b. It can be employed in situations where a big number of people must be transported to a given location and seamless transportation is required.
- 3. Risk detection:
- a. Several organizations were in debt and needed a solution to the problem of fraud.
- b. They already had a large amount of customer data, so they used data analytics.
- c. They applied a ‘split and conquer’ strategy to the data, assessing recent expenditure, profiles, and any other relevant information to determine the likelihood of a client defaulting.
- 4. Delivery:
- a. Data analysis is being used by several leading logistic organizations to analyze collected data and increase overall efficiency.
- b. Utilizing data analytics apps, the companies discovered the optimum shipping routes, delivery times, and most cost-effective transportation modes.
- 5. Fast internet allocation:
- a. While it may appear that providing fast internet in every area makes a city ‘Smart,’ in actuality, smart allocation is more vital. Understanding how bandwidth is used in specific locations and for the right reason is required for smart allocation.
- b. It’s also critical to adjust data allocation based on timing and priority. It is anticipated that the financial and commercial sectors use the greatest bandwidth throughout the week, whereas residential sectors require more on weekends. Yet, the situation is far more complicated. Data analytics can help.
- c. For example, by using data analysis tools, a community can attract the attention of high-tech firms, and in such circumstances, larger bandwidth will be necessary.
- 6. Internet searching:
- a. When we use Google, we are utilizing one of the company’s many data analytics applications.
- b. Most search engines, including Google, Bing, Yahoo, and AOL, employ data analytics. To offer the best result for a search query, these search engines employ various algorithms.
- 7. Digital advertisement:
- a. Data analytics has completely transformed digital advertising.
- b. Digital billboards in cities and online banners, i.e., most advertisement sources presently use data analytics and data algorithms.
Q5. Explain various phases of data analytics life cycle.
Ans. Various phases of data analytic lifecycle are:
Phase 1: Discovery:
- 1. During Phase 1, the team learns about the business domain, including important history such as whether the company or business unit has undertaken comparable initiatives in the past and can learn from them.
- 2. The team evaluates the project’s resources in terms of people, technology, time, and data.
- 3. During this phase, important actions include framing the business problem as an analytics challenge and developing initial hypotheses (IHs) to test and learn from the data.
Phase 2: Data preparation:
- 1. The establishment of an analytic sandpit in which the team can work with data and do analytics for the life of the project is required for Phase 2.
- 2. To get data into the sandpit, the team must perform extract, load, and transform (ELT) or extract, transform, and load (ETL). The ETL process should transform data so that the team can work with and analyze it.
- 3. During this phase, the team must also completely acquaint themselves with the data and take actions to condition the data.
Phase 3: Model planning:
- 1. Model planning is the third phase, in which the team chooses the methodologies, strategies, and workflow it will use for the upcoming model construction phase.
- 2. The team investigates the data to learn about the links between variables, and then selects critical variables and the best models.
Phase 4: Model building:
- 1. During phase 4, the team creates data sets for testing, training, and production.
- 2. In addition, the team constructs and executes models in this phase based on the work done in the model planning phase.
- 3. The team also analyzes whether its present tools will suffice to run the models, or if a more robust environment for executing models and work activities is required.
Phase 5: Communicate results:
- 1. In phase 5, the team, in consultation with significant stakeholders, assesses whether the project’s outcomes are successful or unsuccessful based on the criteria defined in phase 1.
- 2. The team should identify key results, calculate the business value, and create a narrative to summarize and communicate findings to stakeholders.
Phase 6: Operationalize:
- 1. The team delivers final reports, briefings, code, and technical documents in phase 6.
- 2. In addition, the team may conduct a pilot project to test the models in a production setting.
Q6. What are activities that are performed in model planning phase?
Ans. Activities that are performed in model planning phase are:
- 1. Assess the structure of the datasets:
- a. One element influencing the tools and analytical approaches for the following step is the structure of the data sets.
- b. Different tools and methodologies are necessary depending on whether the team intends to evaluate textual or transactional data.
- 2. Verify that the analytical techniques allow the team to fulfill business objectives and accept or reject working hypotheses.
- 3. Decide whether a single model or a series of procedures can be used as part of a wider analytic workflow.

Data Analytics Btech Quantum PDF, Syllabus, Important Questions
| Label | Link |
|---|---|
| Subject Syllabus | Syllabus |
| Short Questions | Short-question |
| Question paper – 2021-22 | 2021-22 |
Data Analytics Quantum PDF | AKTU Quantum PDF:
| Quantum Series | Links |
| Quantum -2022-23 | 2022-23 |
AKTU Important Links | Btech Syllabus
| Link Name | Links |
|---|---|
| Btech AKTU Circulars | Links |
| Btech AKTU Syllabus | Links |
| Btech AKTU Student Dashboard | Student Dashboard |
| AKTU RESULT (One VIew) | Student Result |