“With our AKTU question paper and solution, explore the fascinating world of Electronic Instrumentation and Measurements. Young learners are introduced to the fundamentals of measurement and instruments through notes written for them.
Dudes 🤔.. You want more useful details regarding this subject. Please keep in mind this as well.

Important Questions For Electronic Instrumentation and Measurements:
*Quantum          *B.tech-Syllabus
*Circulars           *B.tech AKTU RESULT
* Btech 3rd Year
Section A: Electronic Instrumentation and Measurements Short Notes
a. Three resistances have the following rating R1 = 25 Ω ± 5% R2 = 43 Ω ± 2% R3 = 85 Ω ± 5%. Determine the magnitude and limiting error in ohms if resistance is connected in series.
Ans. Given: R1 = 25 Ω ± 5% R2 = 43 Ω ± 2% R3 = 85 Ω ± 5%.
To Find: Magnitude and limiting error.
1. The values of resistances are
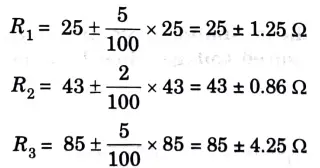
2. The resultant is
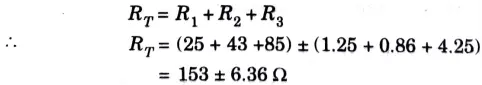
3. Resultant is 153 Ω, limiting error in ohms = 6.36 Ω.
b. Define the systematic error with example.
Ans. A. Systematic error:
- 1. The instrument’s flaws and the properties of the material it was made of are to blame for the systematic inaccuracies.
- 2. The measurand cannot be observed repeatedly and directly using the same method each time to identify these problems.
- 3. The only way to find these inaccuracies is to repeat the tests using different equipment, various settings, and, whenever possible, a completely alternative approach.
- 4. These errors could be environmental, instrumental, or observational.
B. Example: The resistance of the voltmeter may alter the circuit voltage when it is used to measure the potential difference between two locations in a circuit. The amount of a current may also shift in response to an ammeter resistance. Systematic errors also include errors brought on by inaccurate measuring devices.
c. Define the term resolution and significant figure.
Ans. A. Resolution: Resolution is the measurement of the smallest change in the value that can be distinguished clearly.
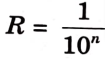
where, n = Number of full digits.
B. Significant figure: Significant figures are the number of digits that add to the correctness of a value, frequently a measurement.
d. What is mean by residual resistance and inductance in the Q meter ?
Ans. Residual resistance: The difference between the value of (resonating capacitance + Q) and resistance of the measurement coil is known as the residual in the Q meter circuit.
Residual inductance: Despite the fact that the resistors used in the Q meter are assumed to be non-inductive, their inductance is always present. Residual inductance is the name for this little intrinsic inductance of the resistors.
e. What is mean by interpolation in oscilloscopes?
Ans. Digital oscilloscopes typically include the ability to draw lines between the sampled levels in order to produce a more accurate representation than the dot or step waveform. This process is known as interpolation.
f. What a sensitivity of voltmeter?
Ans. Sensitivity of voltmeter is the ratio of resistance of the instrument (Rm) to full scale reading.
g. Define the term data acquisition systems.
Ans. For large-scale recording, i.e., in power plants, data acquisition systems are used for input signals like temperature, pressure, velocity, flow rate, force, etc. Applications for it include electronics, communications, and medicine.
h. What are the factors influencing the choice of transducer?
Ans.
- i. Operating principle.
- ii. Sensitivity.
- iii. Operating range.
- iv. Accuracy.
- v. Cross sensitivity.
i. Why calibration of a measuring instrument is important ?
Ans. Importance of calibration:
- 1. Assurance of accurate measurements.
- 2. Ability to trace measurements to international standards.
- 3. Correct diagnosis of illness (medical reports).
- 4. Consumer protection (legal metrology).
j. What is the role of time base circuit in CRO ?
Ans.
- 1. The deflecting voltage increases linearly with time to produce a time base waveform in a CRO or an image.
- 2. The beam is linearly deflected over the screen and returned to its originating place using a time base generator.
Section B: Electronic Instrumentation and Measurements Long Questions
a. Explain the working principle of PMMC type equipment using torque equation.
Ans.
- 1. The moving coil is positioned in a strong magnetic field created by the permanent magnet. As a result, the magnetic field of the permanent magnet interacts with the field of the moving coil.
- 2. As the permanent magnet’s magnetic field is not disturbed by the coil’s magnetic field when no current is flowing through it, there is no deflection in the PMMC.
- 3. The interplay of two fields, which occurs when current passes through the coil, produces a controlling electromagnetic torque that rotates the coil.
- 4. The coil has a pointer attached to it that is extended to a scale. The scale is calibrated to show the amount of current flowing through the coil, which is inversely proportional to coil deflection.
- 5. Each end of the coil has a pair of hair springs made of phosphor bronze material attached. When the applied current is zero, these springs force the coil to return to its starting position.
- 6. The relationship between the electromagnetic torque is
TD = BANI
where, TD → Developed or deflecting torque, in N-m
B → Flux density in air gap, in Wb/m2 (Tesla)
A → Effective coil area, in m²
N → Number of turns of coil
I → Current in the movable coil, in amperes (A)
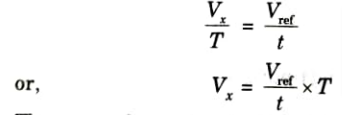
b. Explain the dual slope integrator digital voltmeters system with proper diagram and waveform.
Ans.
- 1. Dual-slope integrating type DVM has five basic blocks:
- i. Op-Amp, used as an integrator
- ii. A level comparator
- iii. A basic block, for generating timing pulses
- iv. A set of decimal numbers
- v. A block of logic circuitry.
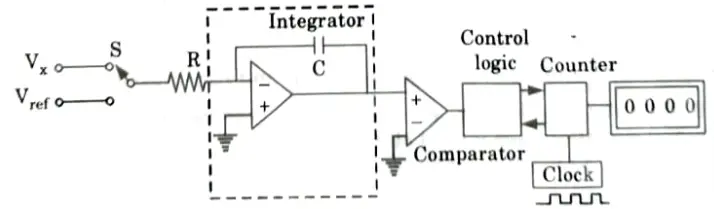
- 2. The unknown voltage Vx is applied through switch S to integrator for a known period of time T. This period is determined by counting the clock frequency in decimal counters.
- 3. During time period T, C is charged at the rate proportional to Vx.

- 4. At the end of the interval T, S is shifted to the reference voltage Vref of opposite polarity.
- 5. The capacitor charge begins to decrease with time and results in downward linear ramp voltage.
- 6. During the second period a known voltage is observed for an unknown time t. This unknown time t is determined by counting timing pulses from the clock until the voltage across the capacitor reaches its basic reference value.
- 7. From similar triangle shown in Fig.
- 8. The count after t which is inversely proportional to the input voltage Vx is displayed as the measured voltage.
- 9. This instrument can be used to measure currents, resistances, and AC voltage by using appropriate signal conditions.
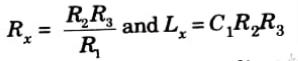
c. Derive the equation for Maxwell bridge and solve a Maxwell inductance bridge uses a standard capacitor C3 = 0.1 μF and operate at a supply frequency of 100 Hz. Balance is achieved when R1 = 1.26 kΩ, R3 =470 Ω, and R4 = 500 Ω. Calculate the inductance and resistance of the measured inductor, and determine its Q factor.
Ans. A. Maxwell’s bridge:
1. Maxwell’s bridge is used for measurement of the inductance having low Q values (i.e., Q < 10).
2. The general equation for bridge balance is
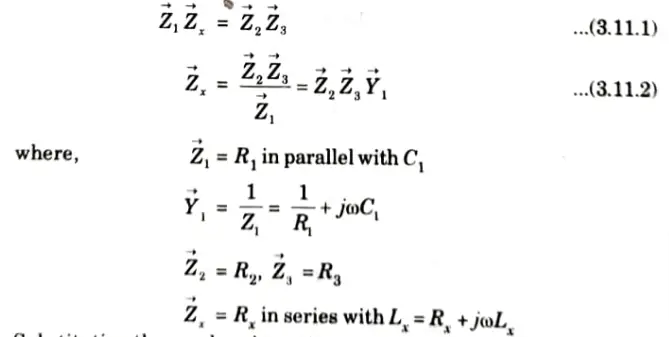
Substituting these values in eq. (3.11.2), we get
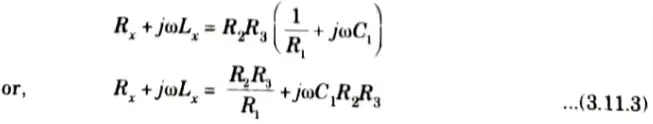
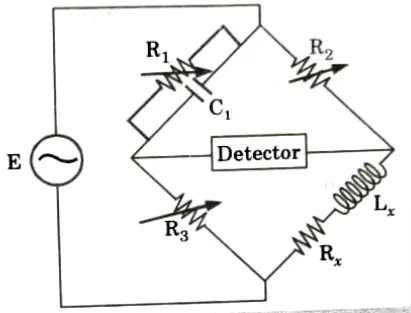
3. Equating real and imaginary terms in eq. (3.11.3), we have
4. To obtain the bridge balance, first R3 is adjusted for inductive balance and R1 is adjusted for resistive balance, the quality factor of coil is given by
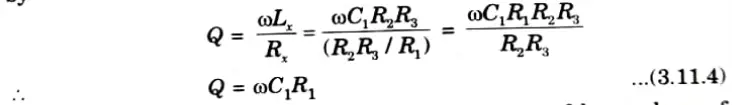
5. Maxwell’s bridge is limited for the measurement of low values of Q(1 < Q < 10).
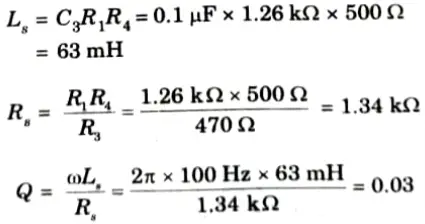
B. Numerical:
d. Explain the working principle, block diagram and waveform of sampling oscilloscope.
Ans. A. Sampling oscilloscope:
- 1. By sampling the input waveform and reconstructing its shape from the sample, it is specifically designed for monitoring very high frequency signals.
- 2. Because the frequency range of a typical oscilloscope is constrained by the gain bandwidth product of its vertical amplifier, such high frequency oscillations cannot be observed with one.
- 3. The sampling gate receives the input. It momentarily biases the sampling gate’s diode in the forward direction. Hence, the gate input capacitance is connected to the test point.
- 4. In order to allow the input signal to start the horizontal sweep, the signal frequency and sampled waveform are synchronized. This produces a delay in the vertical amplifier.
- 5. At the beginning of each sampling cycle, the trigger pulse activates the oscilloscope and a linear ramp voltage is generated.
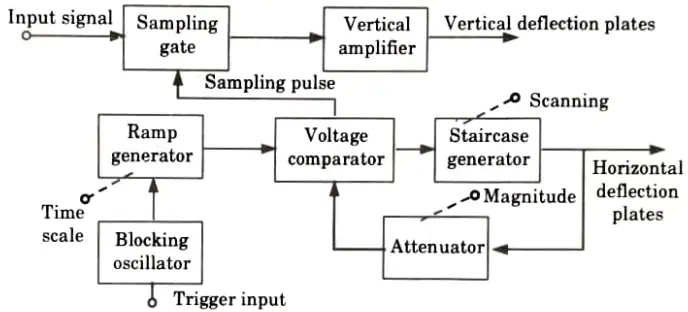
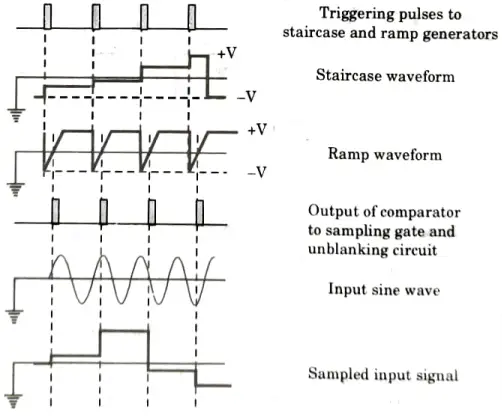
- 6. A voltage comparator receives this ramp voltage and compares it to a staircase generator that is allowed to advance one step while also applying a sample pulse to the sampling gate.
- 7. The input voltage sample is now applied to the vertical deflection plates after being amplified. After 50 MHz, between 500 MHz and 10 GHz, it can be used.
e. Describe the Hall-effect transducers with their application.
Ans. A. Hall-effect transducers:
- 1. According to the Hall Effect transducer’s basic operating principle, a potential difference is created between the conductor’s opposing edges when a strip of conducting material conducts a current in the presence of a transverse magnetic field.
- 2. The current, the strength of the magnetic field, and a feature of the conductor known as the “Hall Effect” all affect how much voltage is present.
- 3. Depending on the densities and mobilities of the carriers, the Hall Effect can be found in metals and semiconductors in variable degrees.
B. Applications of Hall-effect transducer: The various applications are as follows:
- a. Magnetic to electric transducer:
- i. A magnetic to electric transducer can be made from a Hall-effect transducer.
- ii. The magnetic field that needs to be measured has a semiconductor plate inserted into it.
- iii. The magnetic lines of force cross the semiconducting plate at an angle.
- iv. The Hall element can be introduced into small gaps for magnetic measurement in air spaces because the transducer produces an output voltage that is proportional to B, the magnetic field, and other factors.
- b. Measurement of displacement: When a change in the geometry of a magnetic structure results in a change in the magnetic field strength, the Hall-effect element can be utilised to measure the location or displacement of a structural element, operating as proximity or indirect acting position displacement transducers.
- c. Measurement of current:
- i. Without interrupting the circuit or establishing an electrical connection between the conductor circuit and the metre, the gadget measures current in a conductor.
- ii. As current (AC or DC) flows through the conductor, a magnetic field forms around it. The current has a direct relationship with this magnetic field.
- iii. A Hall-effect transducer is inserted into a magnetic concentrator that has slots in the ferro-magnetic tube. The strength of the magnetic field and, consequently, the current flowing through the conductor, determine the voltage generated at the output terminals.
- iv. The system is capable of measuring current in the range of milliamps to thousands of amps.
- d. Measurement of power:
- i. Power is measured using a Hall-effect multiplier.
- ii. The voltage to be measured is proportional to the current passing through the Hall-effect element, and the current to be measured is proportional to the magnetic field density.
- iii. As a result, the Hall-effect element’s output voltage is proportional to the power being measured.
Section 3: Galvanometer Applications
a. Draw and explain galvanometer with its proper application.
Ans. A. Construction:
- 1. A PMMC device that is sensitive to incredibly low current levels is called a galvanometer.
- 2. The simplest galvanometer is a very sensitive instrument with the type of center-zero-scale as shown in Fig.(a).
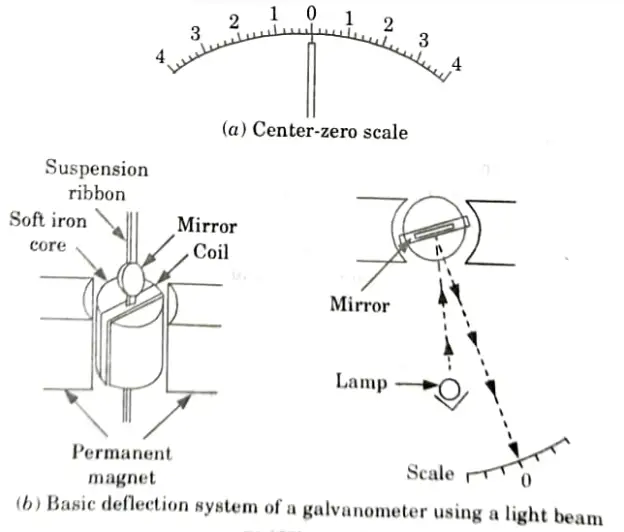
- 3. The deflection system is arranged so that the pointer can deflect depending on the direction of current through the moving coil.
B. Working:
- 1. The deflecting torque is inversely proportional to the coil’s size, number of turns, and current flow.
- 2. The taut-ban suspension is used in the most sensitive moving coil galvanometers, and the twist in the suspension ribbon produces the governing torque. Winding the coil on a non-magnetic conducting coil former can produce eddy current damping.
- 3. In some cases, a non-conducting coil former is used, in which case the moving coil is the only source of the damping currents. In this instance, a damping resistor that limits the amount of eddy currents produced by the coil motions shunts the coil.
- 4. It is common to indicate a critical damping resistance value, which provides just enough damping to allow the pointer to immediately settle down with only a very slight, brief oscillation.
C. Uses of galvanometers:
- 1. In measurement of small currents.
- 2. Sometimes used as a null meter or null detector for detecting zero current or voltage in a circuit rather than to measure the actual level of voltage or current.
- 3. In measurement of low level voltages.
b. The following values were obtained from the measurements of the values of 41.7, 42.0, 41.8, 42.0, 42.1, 41.9, 42.0, 41.9, 42.5 and 41.8. Calculate
i. The arithmetic mean
ii. The standard deviation
iii. The probable error of one reading.
iv. The probable error of mean
v. Range.
Ans.
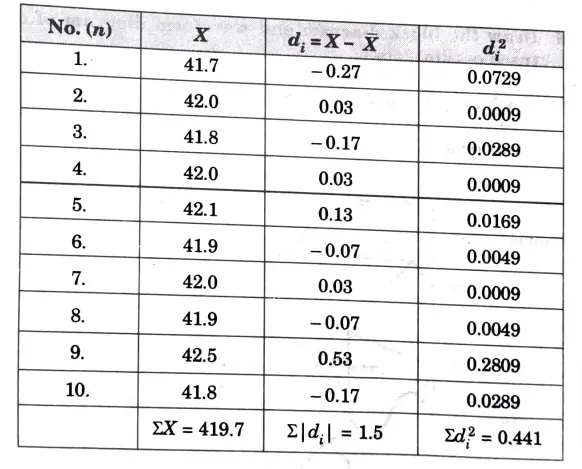
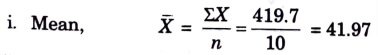
ii. Standard deviation is,
iii. Probable error of one reading,
e = 0.6745 x σ
= 0.6745 x 0.2213 = 0.1493
iv. Probable error of the mean,
v. Range = 41.7 to 42.5 = 0.8
Section 4: AC Electronics Voltmeter Circuits
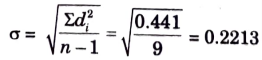
a. Explain the digital frequency meter system for forward counting using suitable block diagram.
Ans. 1. The basic block diagram of a digital frequency meter and its associated waveforms are shown in Fig.
- 2. This metre counts the cycles of the frequency to be measured over a predetermined amount of time.
- 3. Every repeating waveform, including sinusoidal, square, triangular, and other types, can have their frequency measured by this instrument.
- 4. The wave-shaping circuit transforms the input signal into a square or pulse waveform with the same frequency as the input after it has been amplified or muted as necessary.
- 5. One input terminal of a two-input AND gate is fed the shaped waveform, and the other input of the AND gate is controlled by the flip-output. flop’s
- 6. As a result, only when the flip-flop Q terminal is high do the pulses that need to be counted pass through the AND gate.
- 7. The timing circuit regulates the flip-flop, which changes states when the timer output waveform moves in the opposite direction.
- 8. When the timing circuit’s output frequency is 1 Hz, the flip-Q flop’s output terminal alternates between being high for a duration of l sec and low for 1 sec. The cumulative count in this instance directly represents the frequency in hertz after the counting circuits have been toggled for a duration of one second.
- 9. The flip-Q flop’s output’s negative going edge resets the counting circuit. As a result, the count always begins at 0.
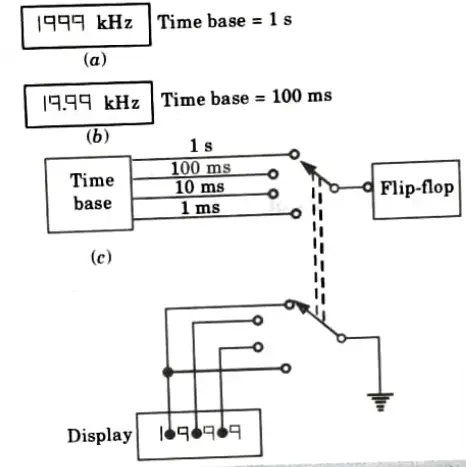
- 10. To make the digital display readable, latch or digital enable circuits are needed. Via the flip-Q flop’s output, latch circuits are positively edge-triggered. Here, a time base circuit and a digital frequency meter are employed to provide multiple frequency measurement ranges.
- 11. A time base will display 1999 cycles of the input waveform every l sec as 1.999 kHz if it uses a time period of 1 sec to count the input pulses. Similarly, if a time period of 100 ms is chosen, 1999 cycles of the input waveform are shown every 100 ms as 19.99 kHz.
b. Explain the working principle of AC electronics voltmeter circuits using proper circuit diagram.
Ans. Working principle of electronic voltmeter:
- 1. An Op-Amp voltage-follower AC voltmeter can be converted into an AC electronic voltmeter by connecting a rectifier in series with the meter circuit. Such a circuit is shown in Fig.
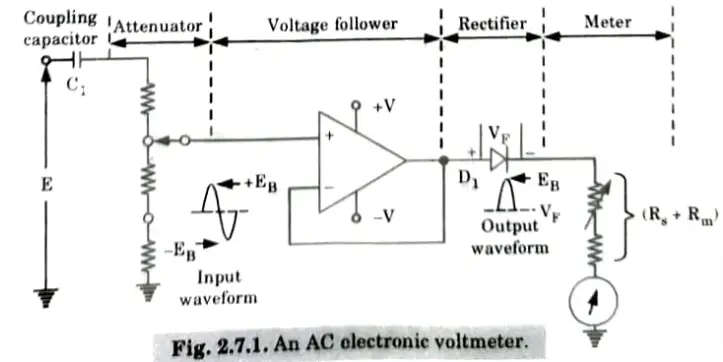
- 2. An AC input signal (to be measured) is applied to non-inverting terminal input of Op-Amp. The coupling capacitor C1 in this circuit is used to block unwanted DC voltages.
- 3. The output from the voltage follower is exactly the same as the AC input signal.
- 4. This output voltage is fed to the rectifier which gives a half-wave rectified version of the input signal. This rectified voltage is applied to the meter circuit.
- 5. The limitation of this circuit is that the voltage drop (VF) across the rectifier acts as an error which must be taken into account in design calculation when the instrument is indicating full scale.
- 6. This error can be avoided by using a precision rectifier.
Section 5: Kelvin Double Bridge
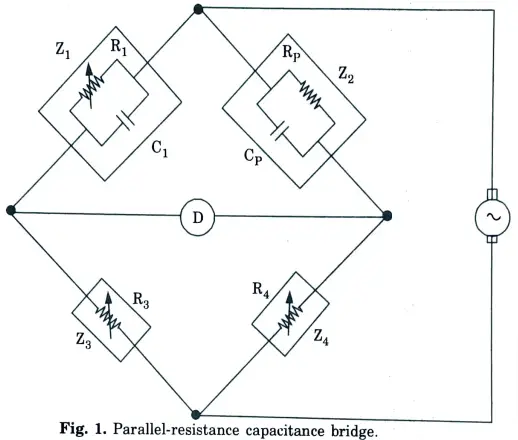
a. Derive the balancing equation for parallel resistance capacitance bridge with proper circuit diagram.
Ans.
- 1. The circuit of a parallel-resistance capacitance bridge is illustrated in Fig.
- 2. In this case, the unknown capacitance is represented by its parallel equivalent circuit, Cp in parallel with Rp, Z3 and Z4 are resistors, as before, either or both of which may be adjustable.
- 3. Z2 is balanced by a standard capacitor C1 in parallel with an adjustable resistor R1.
- 4. Bridge balance is achieved by adjustment or R1 and either R3 or R4.
- 5. The parallel-resistance capacitance bridge is found to be most suitable for capacitors with a low resistance dielectric.
- 6. At balance,
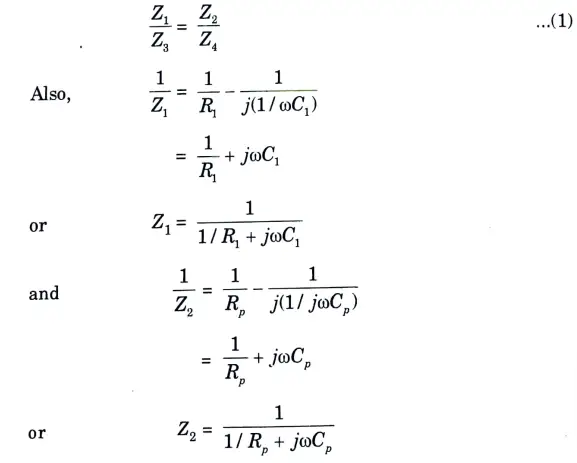
7. Substituting the value of Z1, Z2, Z3 and Z4 into eq. (1)
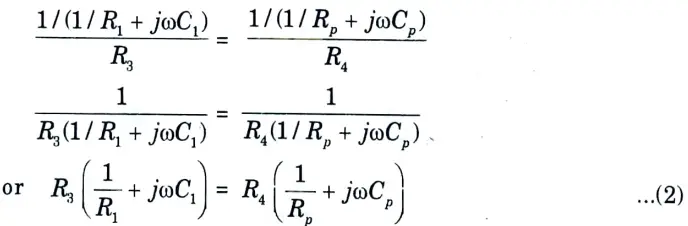
8. Equating the real terms in eq. (2)
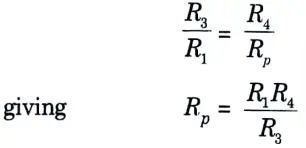
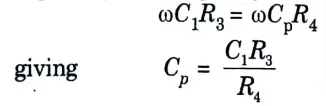
9. Equating the imaginary terms in eq. (2)
b. What is Kelvin double bridge? Derive the balance equation for Kelvin double bridge.
Ans.
- 1. Kelvin’s double bridge is used for measuring low resistances (micro ohms to 1 Ω).
- 2. It improves accuracy and is a variation of Wheatstone’s bridge.
- 3. It uses four terminal resistances for the low resistance arms and adds the concept of a second set of ratio arms, hence the name double bridge.
- 4. The circuit diagram is shown in Fig.
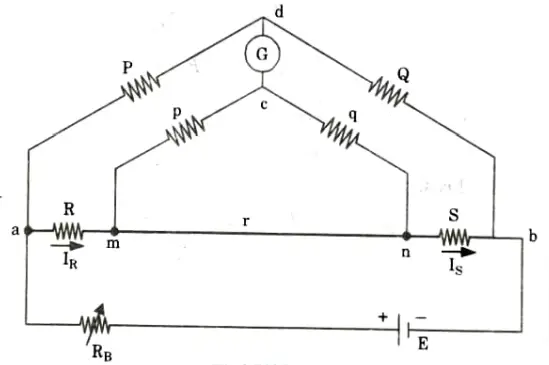
R = Unknown resistance
S = Standard resistance of the order of magnitude as R
r = Connecting link of low resistance
- 5. P,Q and p, q are two pairs of known non-inductive resistances and one pair P, p or Q, q is variable.
- 6. The ratio p/q is made equal to P/Q. Under balanced conditions there is no current through galvanometer
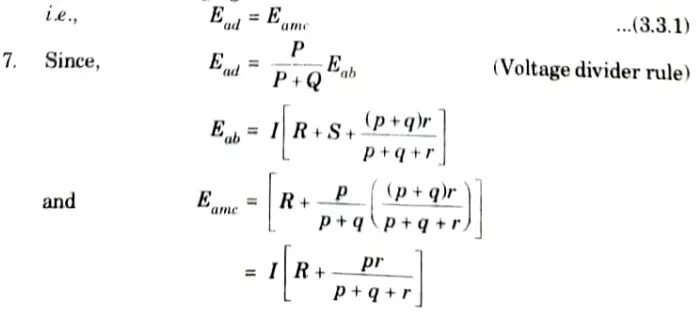
- 8. For balanced condition
Section 6: Working Principle of CRT
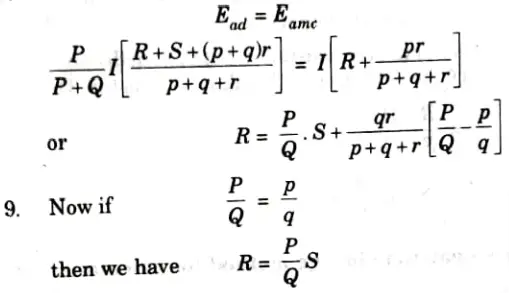
a. Draw the block diagram and waveform of DSO with its unique application.
Ans. A. DSO:
- 1. The waveform is sampled at regular intervals and each sample is transformed to digital form using an analogue to digital converter in a digital storage oscilloscope.
- 2. Fig. depicts the block diagram of a fundamental DSO sampling and storage system.
- 3. A pulse waveform is produced at the required sampling frequency by the time base in this case. At each pulse, the sampling gate and the ADC are briefly turned ON.
- 4. A sequence of analogue samples are produced by the sampling gate, and the ADC transforms each sample into a coded collection of pulses.
- 5. After that, the pulse groups are sent to a semiconductor or another type of memory, where they are stored for potential recovery in the future.
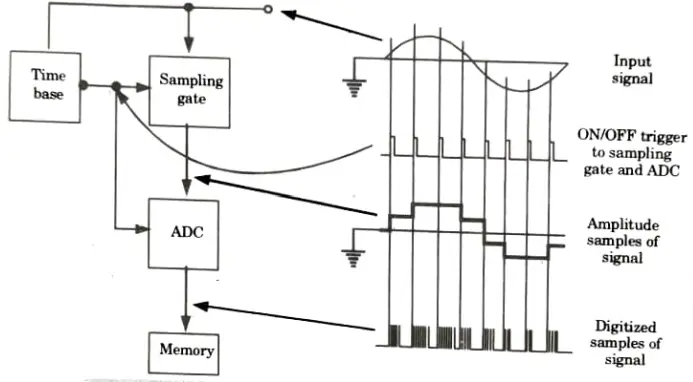
- 6. The technique for recovering the stored information to restore the original waveform is depicted in Fig. Each digital sample is converted back to analogue form by the digital to analogue converter (DAC), which is triggered by pulses from the time base, and then sent to the oscilloscope vertical deflection amplifier.
- 7. The horizontal deflection amplifier receives a staircase waveform that is produced by the time base as well. On the oscilloscope screen, the vertical and horizontal inputs can be used to generate either a dot waveform.
B. Application:
- 1. Autoset: Similar to an analogue oscilloscope, certain digital storage oscilloscopes offer controls for the vertical (volts/div) and horizontal (time/div) axes.
- 2. Multichannel displays: In most cases, digital storage oscilloscopes can show waveforms applied to two input channels.
- 3. Waveform processing: Digital voltmeters, digital frequency meters, and time measurement circuits are typically found in digital oscilloscopes. These circuits print the appropriate measurements on the oscilloscope screen as the waveform is being presented. The waveform locations between which the measurement is to be taken are defined using two cursors.
- 4. Pre-triggering and post-triggering: A DSO can be used to show waveform segments that start or end before or after the typical trigger point. The input waveform is continuously digitalized and stored in memory, making pre-triggering feasible.
- 5. Zoom and restart: Restart and zoom are simply different ways to choose a time delay, and both are accessible with some DSO. Then, the screen’s centre or cursors are used to indicate the section of the displayed waveform that has to be investigated.
- 6. Glitch and runt catching: Where such waveform anomalies are significant, an oscilloscope with a very high sampling rate should be utilized since oscilloscopes cannot see glitches that happen during the sampling time span. Some DSOs use a maximum/minimum level detector circuit to identify the existence of a glitch.
- 7. Baby-sitting mode: To handle a specific condition, such as the occurrence of a waveform only once throughout an hour, a DSO can be configured in a babysitting mode. Since this waveform is continuously sampled and recorded, a number of recent cycles are always retained. The stored samples are kept in the memory for later playback when an abnormality is found.
b. Describe the working principle of CRT with their proper diagram.
Ans. A. Cathode-Ray Tube (CRT):
- 1. The basic construction and biasing of a cathode-ray tube are shown in Fig.
- 2. An evacuated glass tube with a viewing screen at one end houses the electrode system.
- 3. The cathode produces an electron beam that is aimed at the screen, where it strikes the phosphor coating and causes the screen to illuminate.
- 4. Externally applied voltages cause the electron beam to be deflected both vertically and horizontally.
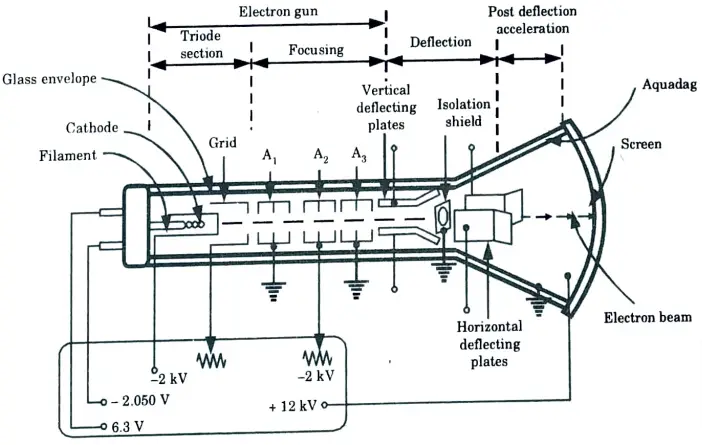
B. The components of cathode-ray tube are:
- 1. Triode section:
- i. A cathode, a grid, and an anode make up the triode component of the tube.
- ii. The nickel cup-shaped grid, which has a hole in it, nearly fully encloses the cathode.
- iii. The cathode, which is likewise constructed of nickel, is formed like a cylinder and has a flat, oxide-coated surface that emits electrons in the direction of the grid hole.
- iv. An internal filament provides cathode heating.
- 2. Focusing section:
- i. The focusing electrodes A1, A2 and A3 are sometimes referred to as an electron lens.
- ii. The function of the electron lens is to focus the electrons to a fine point on the screen of the tube.
- iii. A1 provides the accelerating field to draw the electrons from the cathode, and the hole in A1 limits the initial cross section of the electron beam.
- iv. A3 and A1 are held at ground potential while the A2 potential is adjustable around -2kV.
- v. The negative potential on A2 tends to slow down the electrons, but they are accelerated again by A3 so that the beam speed leaving A3 is the same as when entering A1.
- vi. The electrons are traveling at a constant velocity as they pass between the deflecting plates.
- 3. Deflection section:
- i. The electrons in the beam are drawn to and repelled from the positive plate when one of a pair of deflecting plates has a positive voltage applied to it while the other has a negative potential.
- ii. The electrons are actually accelerated in the direction of the positive plate.
- 4. Screen:
- i. The colour of the glow produced at the screen can be blue, red, green, or white depending on the materials used.
- ii. The screen’s phosphor is an insulator, and without secondary emission, the screen would become negatively charged as the primary electrons gathered.
- iii. Eventually, the negative potential would rise to the point that it repealed the electron beam.
- iv. In order to prevent the negative potential from building up on the screen, the secondary electrons are gathered by a graphite coating known as aquadag around the tube’s neck.
- 5. Brightness of display:
- i. The amount of electrons in the beam affects how bright the glow created at the screen is.
- ii. The grid voltage control acts as a brightness control since it regulates the cathode’s electron output.
- iii. Beam speed affects brightness as well, therefore for best brightness, electrons should be accelerated to their highest velocity.
Section 7: Types of Thermocouple
a. How does an LVDT work? Explain the working principle of LVDT with its application.
Ans. LVDT: An inductive type of transducer called a linear variable differential transformer converts linear motion into electrical signals.
A. Main features of construction:
- 1. The transformer consists of a primary winding P and two secondary windings S1 and S2 wound on a cylindrical former (which is hollow in nature and contains the core).
- 2. We position the secondary windings on either side of the primary winding, each of which has an equal number of turns.
- 3. By connecting the primary winding to an AC source, a flux is created in the air gap and voltages are induced in the secondary windings.
- 4. The former is filled with a moveable, soft iron core, and the iron core is connected to the displacement gauge.
- 5. The iron core often has a high permeability, which lowers harmonics and increases LVDT sensitivity.
- 6. To provide electrostatic and electromagnetic shielding, the LVDT is housed inside a stainless steel enclosure.
- 7. The both the secondary windings are connected in such a way that resulted output is the difference between the voltages of two windings as shown in Fig.
B. Principle of operation and working:
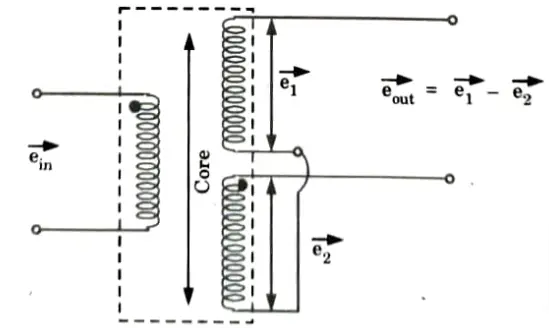
- 1. As the primary is connected to an AC source so alternating current and voltages are produced in the secondary of the LVDT. The output in secondary S1 is e1 and in the secondary S2 is e2 So the differential output is,

- 2. Eq. (5.10.1) explains the principle of operation of LVDT.
- 3. Now three cases arise according to the locations of core which explains the working of LVDT:
- a. Case I: When the core is at null position (for no displacement):
- i. When the core is at null position then the flux linking with both the secondary windings is equal so the induced emf is equal in both the windings.
- ii. So for no displacement the value of output eout is zero as e1 and e2 both are equal. So it shows that no displacement took place.
- b. Case II : When the core is moved to upward of null position (For displacement to the upward of reference point):
- i. In this case the flux linking with secondary winding S1 is more as compared to flux linking with S2. Due to this e1 will be more as that of e2. Due to this output voltage eout is positive.
- c. Case III: When the core is moved to downward of null position (for displacement to the downward of the reference point):
- i. In this case magnitude of e2 will be more as that of e1. Due to this output eout will be negative and shows the output to downward of the reference point.
b. Where are thermocouple used ? Explain various types of thermocouple in detail.
Ans. A. Application:
- 1. Thermostats in homes and offices employ them as the temperature sensor.
- 2. They are employed in the industry to check the metal temperatures of iron and aluminium.
- 3. They are utilized in gas machines for pilot flame detection.
- 4. Chemical and petroleum plants utilise these to measure temperature.
B. Types of thermocouple: Different types of thermocouple:
i. Type K thermocouple:
- 1. The K type thermocouple has the largest temperature measuring range and is the most widely used type of thermocouple.
- 2. Around 90% nickel and 10% chromium make up the positive lead of a type K thermocouple. Around 95% nickel, 2% aluminium, 2% manganese, and 1% silicon make up the negative lead.
- 3. The positive lead is made of a non-magnetic substance and is coloured yellow. The negative lead is made of magnetic material and is coloured red. Also, the colour of the overcoat is yellow.
- 4. The temperature range of type K thermocouple is – 200 °C to +1260 °C (-328 F to + 2300 F).
- 5. It is inexpensive and widely used in the general purpose applications where temperature sensitivity requires approximately 41 μV/°C.
ii. Type T Thermocouple:
- 1. Thermocouples of this kind are appropriate for measuring low temperatures. The negative lead is made of constant (45% nickel and 55% copper), while the positive lead is made of copper.
- 2. The sensitivity of the type T thermocouple is 43 μV/°C. This thermocouple is suitable to works in an oxidizing atmosphere. The temperature range of this thermocouple is -200 °C to 350 °C.
iii. Type J Thermocouple:
- 1. The most common and affordable type of thermocouple is this one. A negative lead is built of constantan (45% nickel and 55% copper), while the positive lead is made of iron.
- 2. The negative terminal is red, and the positive lead is white. Also, the colour of the overcoat is black.
- 3. The temperature range of type J thermocouple is – 210°C to 750 °C (-346 F to 1400 F).
- 4. This type of thermocouple has a smaller temperature range and short life span compared to type K thermocouple. But this type of thermocouple is well suited for the oxidizing atmospheres.
- 5. The accuracy of this type of thermocouple is ± 2.2 °C (0.75 %).
v. Type E Thermocouple:
- 1. For moderate temperature ranges, this type of thermocouple has superior accuracy and a stronger signal than type K and J thermocouples. And it is a thermocouple type that is more stable than type K.
- 2. Compared to other types of thermocouples, the type E thermocouple generates the maximum EMF per degree.
- 3. The negative terminal is made of constantan, which is made up of 95% nickel, 2% aluminium, 2% manganese, and 1% silicon, and the positive lead is formed of nickel-chromium (90% nickel and 10% chromium).
- 4. The positive lead is colored purple and negative lead-colored red.
- 5. The temperature range of this type of thermocouple is – 270 °C to 870°C (454 to 1600 F).
- v. Type N Thermocouple:
- 1. The accuracy and temperature limits of type N thermocouple are the same as the type K thermocouple.
- 2. The temperature range of type N thermocouple is – 270 °C to 1300 °C. Sensitivity is slightly lower than type K thermocouple and it is 39 μV/ °C.
- 3. This thermocouple is the best alternative of type K thermocouple for low oxygen conditions.
vi. Type S Thermocouple:
- 1. Applications requiring greater temperatures use Type S thermocouples. Because to its excellent accuracy and stability, it is occasionally used at low temperatures as well.
- 2. The type S thermocouple has a temperature range of 630 °C to 1064 °C.
- 3. The negative lead is made of platinum, and the positive lead is 90% platinum and 10% rhodium.
vii. Type R Thermocouple:
- 1. Platinum and rhodium are also components of type R thermocouples. Nonetheless, the type R thermocouple has a somewhat wider output range and greater stability than the type S thermocouple.
- 2. A type R thermocouple’s positive lead is made up of 87% platinum and 13% rhodium. Platinum makes up the negative lead as well.
- 3. The temperature range of this thermocouple is 0 °C to 1600 °C.
viii. Type B Thermocouple:
- 1. Platinum and rhodium are also used to make Type B thermocouples.
- 2. A thermocouple’s positive lead is made up of 30% rhodium and 70% platinum. And 94% platinum and 6% rhodium make up the negative lead.
- 3. Temperatures up to 1800°C can be measured using a Type B thermocouple. However, this thermocouple’s output is less than that of type R and S thermocouples.
5 thoughts on “Electronic Instrumentation and Measurements: Solved Question Paper Aktu Notes”