
With our AKTU question paper and solution, you can unleash the power of Data Analytics. Comprehensive notes offer ideas and approaches for maximising the power of data-driven decision making.
Dudes 🤔.. You want more useful details regarding this subject. Please keep in mind this as well.

Important Questions For Data Analytics:
*Quantum          *B.tech-Syllabus
*Circulars           *B.tech AKTU RESULT
* Btech 3rd Year
Section A: Data Analytics Short Notes
a. Differentiate between Predictive and Prescriptive Data analytics.
Ans.
| S. No. | Predictive analytics | Prescriptive analytics |
| 1. | It provides insight into what is likely to happen in the future and how things are progressing. | It insights on what things to do and how to do them. |
| 2. | It measures the metric individually and it does not evaluate the overall impact. | It evaluates the whole impact by measuring the metrics while taking into account all inputs, outputs, and processes. |
b. Differentiate between Analysis and Reporting.
Ans.
| S. No. | Analysis | Reporting |
| 1. | It explains why something is happening. | It explains what is happening. |
| 2. | It transforms data and information into insights. | It transforms raw data into information. |
c. What is lasso regression ?
Ans. Lasso regression analysis is a shrinkage and variable selection method for linear regression models. The goal of lasso regression is to obtain the subset of predictors that minimizes prediction error for a quantitative response variable.
d. Differentiate between Univariate and Multivariate analysis.
Ans.
| S. No. | Univariate analysis | Multivariate analysis |
| 1. | It summarizes only one variable at a time. | lt summarizes more than two variables at a time. |
| 2. | Basic logic of univariate analysis is by means of contingency tables, distributions, continuous and discrete variables etc. | Basic logic of multivariate analysis is by means of contingency tables only. |
e. How is steam Processing different from Traditional Data Processing?
Ans.
| S. No. | Stream processing | Traditional processing |
| 1. | It involves complex operations on multiple input streams when data is being processed. | It involves simple computations on data when data is being processed. |
| 2. | It stores data in a more summarized form. | It stores data in raw form. |
f. What is the role of sliding window in analysis of streaming data ?
Ans. The sliding window technique is used to control transmitted data streaming packets. It is utilized when the transmission of data streaming packets must be dependable and sequential. Tuples are gathered within a window that glides over the data stream at a given interval in a sliding window.
g. Explain the principle behind hierarchal clustering technique.
Ans. Hierarchical clustering starts by treating each observation as a separate cluster. Then, it repeatedly executes the following two steps:
- 1. Determine the two clusters that are the most closely related.
- 2. Combine the two groups that are the most similar. This iterative process is repeated until all of the clusters have been blended together.
h. Define lift in association data mining.
Ans. Lift is a measure of a targeting model’s (association rules) success at predicting or classifying cases as having an enhanced response as compared to a random choice targeting model in association rule learning.
i. What is the basic description of a box plot in R?
Ans. Box plots are used to determine how evenly dispersed the data in a data set is. It categorizes the data into three quartiles. This graph depicts the data set’s minimum, maximum, median, first and third quartiles.
j. List two data visualization tool.
Ans. Following are the two visualization tools:
- 1. Tableau
- 2. Looker
Section B: Data Analytics Long Question with Answer
a. Explain the Process Model and Computation Model of Big Data platform.
Ans. Process Model of Big Data platform:
- 1. MapReduce is a distributed computing technique for processing enormous amounts of data and is used throughout the whole Hadoop ecosystem.
- 2. With this structure, data processing in massive distributed systems is made simpler for developers.
- 3. The calculation of specific business logic is as follows:
- i. The first is to split big file for decentralized operation processing.
- ii. The big file is split into multiple small files with the same size.
- iii. These small files are processed in parallel by multiple map processes.
- iv. The outputs of the processing are immediately passed on to the reduce process, which will quickly sum up and compute the map results.
- v. The final calculation results will be directly output to HDFS.
Computation Model of Big Data platform:
- 1. The technology that aids in data analysis, processing, and management to produce meaningful information is computational modelling.
- 2. The difficulty facing the modern industry is how to deal with identifying challenges in computational models by incorporating knowledge into Big Data applications.
- 3. In order to enable analysts swiftly adapt models to new insights, the methodologies and models are given with instructions.
- 4. The decision support system is a powerful system that has a big impact on how Big Data is shaped for long-term effectiveness and performance.
- 5. Computational modelling decision-making is also a potent mechanism for enabling effective tools for Big Data management for influential application.
b. Explain the working of an Artificial Neural Network for image classification task.
Ans.
- 1. The process of detecting photographs and classifying them into one of several unique, preset categories.
- 2. Among the tasks in which artificial neural networks (ANNs) excel is image categorization.
- 3. Computer systems that can recognise patterns are known as neural networks.
- 4. Its namesake, the human brain, served as the inspiration for their construction.
- 5. They are made up of input, hidden layers, and output layers.
- 6. A signal is received by the input layer, processed by the hidden layer, and then a judgment or forecast is made regarding the input data by the output layer.
- 7. Each network layer is made up of artificial neurons that are connected nodes.
- 8. A system must first understand the features of a pattern in order to recognise it. To determine if an object is X or Z, it must be trained.
- 9. Artificial neural networks train on data sets from which they directly learn features.
- 10. There are numerous examples of each image class in the training data, which is a sizable dataset.
- 11. Every node layer trains using the output (feature set) generated by the layer before it.
- 12. As a result, nodes in each subsequent layer are able to distinguish increasingly intricate, specific features visual representations of what the image shows.
c. Discuss the Publish / Subscribe model of streaming architecture.
Ans.
- 1. The architectural design pattern known as the Publish/Subscribe pattern, or pub/sub, offers a framework for message exchange between publishers and subscribers.
- 2. In this pattern, a message broker that passes messages from the publisher to the subscribers is used by the publisher and the subscriber.
- 3. The channel’s subscribers can sign up to receive communications (events) that the host (publisher) posts to it.
- 4. A design space for publish/subscribe over data streams is shown in Fig.
- 5. The data model and query language that these systems enable are used to first categorize pub/sub systems.
- 6. Following are the three main categories
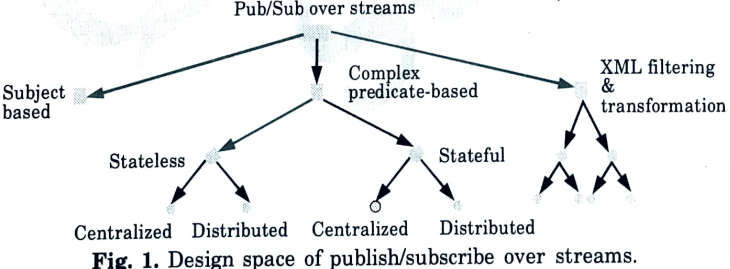
A. Subject-based:
- 1. Each communication is given a subject label from a predefined list (such as a stock quote) or hierarchy (such as sports/cricket).
- 2. Users subscribe to messages related to a specific topic.
- 3. In order to narrow down the collection of pertinent messages within a given subject, these queries can also include a filter on the data elements of the message header.
B. Complex predicate-based:
- 1. Certain pub/sub systems allow user queries to contain predicates coupled using “and” and “or” operators to provide constraints over the values of the attributes. These systems model the message content (payload) as a set of attribute-value pairs.
- 2. For example, a predicate-based query applied to the stock quotes can be “Symbol=’ABC’ and (Change > 1 or Volume > 50000)”.
C. XML filtering and transformation:
- 1. In more recent pub/sub systems, the richness of XML-encoded messages is being utilised.
- 2. A pre-existing XML query language, such as XQuery, can be used to create user queries.
- 3. Messages can be further restructured for customized result delivery and perhaps more accurate filtering thanks to the rich XML structure and usage of an XML query language.
d. What are the advantages of PCY algorithm over Apriori algorithm ?
Ans. The PCY Algorithm makes use of the fact that a lot of main memory is often available during the first pass of A-Priori but is not required for the counting of single items.
During the two passes to find L2, the main memory is laid out as in Fig.
Assume that data is stored as a flat file, with records consisting of a basket ID and a list of its items.
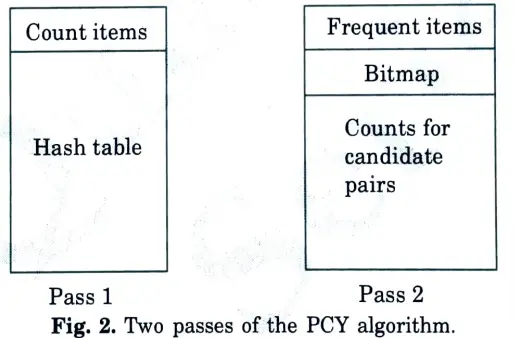
1. Pass 1:
a. Count occurrences of all items.
b. For each bucket, consisting of items {i1,…..,ik}, hash each pair to a bucket of the hash table, and increment the count of the bucket by 1.
c. At the end of the pass, determine L1 the items with counts at least s.
d. Also at the end, determine those buckets with counts at least s.
Key point: a pair (i, j) cannot be frequent unless it hashes to a frequent bucket, so pairs that hash to other buckets need not be candidates in C2.
Replace the hash table by a bitmap, with one bit per bucket: 1 if the bucket was frequent, 0 if not.
2. Pass 2:
a. Main memory holds a list of all the frequent items, i.e., L1.
b. Main memory also holds the bit map summarizing the results of the hashing from pass 1.
Key point: The buckets must use 16 or 32 bits for a count, but these are compressed to 1 bit. Thus, even if the hash table occupied almost the entire main memory on pass 1, its bitmap occupies no more than 1/16 of main memory on pass 2.
c. Finally, main memory also holds a table with all the candidate pairs and their counts. A pair (i, j) can be a candidate in C2 only if all of the following are true:
(i). i is in L. (ii). j is in L1. (iii). (i, j) hashes to a frequent bucket. It is the last, condition that distinguishes FCY from straight a-priori and reduces the requirements for memory in pass 2.
d. During pass 2, we consider each basket, and each pair of its items, making the test outlined above. If a pair meets all three conditions, add to its count in memory, or create an entry for it if one does riot yet exist.
When does FCY beat a-priori ? When there are too many pairs of items from L1 to fit a table of candidate pairs and their counts in main memory, yet the number of frequent buckets in the PCY algorithm is sufficiently small that it reduces the size of C2 below what can fit in memory (even with 1/16 of it given over to the bitmap).
e. What makes NoSQL databases different from RDBMS?
Ans.
| S. No. | NoSQL | RDBMS |
| 1. | It is used to handle data coming in high velocity. | It is used to handle data coming in low velocity. |
| 2. | It gives both read and write scalability. | It gives only read scalability. |
| 3. | It manages all type of data | lt manages structured data. |
| 4. | Data arrives from many locations. | Data arrives from one or few locations. |
| 5. | It supports simple transactions. | It supports complex transactions. |
| 6. | It handles data in high volume. | It handles data in less volume. |
| 7. | Transactions written in many locations. | Transactions written in one location. |
Section 3: Data Analysis Process
a. Discusses the steps involved in Data Analysis Process.
Ans. Steps involved in data analysis are:
- 1. Determine the data:
- a. Determine the data requirements or how the data is grouped as the initial stage.
- b. Data can be divided by gender, income, age, or other factors.
- c. Data values can be categorical or numerical.
- 2. Collection of data:
- a. The second step in data analytics is the process of collecting it.
- b. Many tools, including computers, the internet, cameras, environmental sources, and human employees, can be used to accomplish this.
- 3. Organization of data:
- a. Third step is to organize the data.
- b. Once the data is collected, it must be organized so it can be analyze.
- c. A spreadsheet or other piece of software that can handle statistical data may be used for organization.
- 4. Cleaning of data:
- a. In fourth step, the data is then cleaned up before analysis.
- b. This implies it has been cleaned up and examined to make sure there are no errors or duplicates and that it is not missing anything.
- c. Before the data is sent to a data analyst to be analyzed, this phase helps to correct any inaccuracies.
b. Compare and contrast Traditional Analytics Structure to Modern Analytics Architecture.
Ans. Traditional Analytics vs Modern Analytics:
| S. No. | Traditional Analytics | Modern Analytics |
| 1. | Traditional analytics is based on a fixed schema. | Modern analytics uses a dynamic schema. |
| 2. | It could only work with structured data. | It can include structured as well as unstructured data. |
| 3. | Analytics have always been performed after the event or time period being studied. | In modern analytics, analysis takes place in real-time. |
| 4. | Traditional analytics is based on a centralized architecture. | Modern analytics is based on a distributed architecture. |
| 5. | Traditionally, the sources of data were fairly limited. | There is a data explosion in modern analytics as a result of the numerous sources that record data almost constantly. |
| 6. | In the conventional method of data analytics, users had to choose their initial research topics. | Modern analytics, however, enables a more iterative and exploratory approach. |
| 7. | Transactions written in many locations. | Transactions written in one location. |
Section 4: Time Series Data Analysis
a. Discuss different types of Time Series Data Analysis along with its major application area.
Ans. Types of time series data analysis:
- 1. Determine the data:
- a. The first step is to determine the data requirements or how the data is grouped.
- b. Data may be separated by age, demographic, income, or gender.
- c. Data values may be numerical or be divided by category.
- 2. Collection of data:
- a. The second step in data analytics is the process of collecting it.
- b. This can be done through a variety of sources such as computers, online sources, cameras, environmental sources, or through personnel.
- 3. Organization of data:
- a. Third step is to organize the data.
- b. Once the data is collected, it must be organized so it can be analyze.
- c. Organization may take place on a spreadsheet or other form of software that can take statistical data.
- 4. Cleaning of data:
- a. In fourth step, the data is then cleaned up before analysis.
- b. This means it is scrubbed and checked to ensure there is no duplication or error, and that it is not incomplete.
- c. This step helps correct any errors before it goes on to a data analyst to be analyzed.
Application of time series analysis:
- 1. Retail sales:
- a. A clothes retailer wants to predict future monthly sales for several product lines.
- b. The seasonal influences on customers’ purchase decisions must be taken into consideration in these forecasts.
- c. Demand fluctuations over the course of the year must be taken into account by a suitable time series model.
- 2. Spare parts planning:
- a. To ensure a sufficient supply of parts to fix consumer products, companies service groups must estimate future spare part requests. The spares inventory frequently includes thousands of unique part numbers.
- b. Complex models for each component number can be created to predict future demand using input variables including anticipated part failure rates, the effectiveness of service diagnostics, and anticipated new product shipments.
- c. Yet, time series analysis can produce precise short-term estimates based just on the past history of spare part demand.
- 3. Stock trading:
- a. Pairs trading is a strategy used by some high-frequency stock traders.
- b. In pairs trading, a market opportunity is spotted using a strong positive correlation between the prices of two equities.
- c. Assume that the stock values of Companies A and B move in lockstep.
- d. The variation in these companies’ stock values over time can be analysed using a time series approach.
- e. If the price gap is statistically higher than predicted, it may be a smart idea to buy Company A stock and sell Company B stock, or vice versa.
b. Differentiate different types of support vector and kernel methods of data analysis.
Ans. A. Types of kernel methods:
- 1. Data input is transformed into the format needed for processing data using the kernel approach.
- 2. Kernel is utilised because it gives the Support Vector Machine (SVM) a window through which to change the data.
- 3. Following are major kernel methods:
- i. Gaussian Kernel: It is used to perform transformation when there is no prior knowledge about data.
- ii. Gaussian Kernel Radial Basis Function (RBF): It is similar to the Gaussian kernel, but it also includes the radial basis approach to enhance the transformation.
- iii. Sigmoid Kernel: When employed as an activation function for artificial neurons, this function is comparable to a two-layer perceptron model of the neural network.
- iv. Polynomial Kernel: In a feature space over polynomials of the original variables used in the kernel, it depicts the similarity of vectors in the training set of data.
- v. Linear Kernel: It is used when data is linearly separable.
B. Types of support vector:
- 1. In a supervised machine learning task called a support vector, we look for the optimum hyperplane to divide the two classes.
- 2. Following are two types of support vector machine:
- i. Linear SVM: Only when the data can be separated into linear components perfectly can we employ a linear SVM. The data points must be perfectly linearly separable in order to be divided into two groups by a single straight line (if 2D).
- ii. Non-Linear SVM: Non-Linear SVM can be used to classify data when it cannot be divided into two classes by a straight line (in the case of 2D), which calls for the employment of more sophisticated approaches like kernel tricks. Since linearly separable datapoints are rare in real-world applications, we apply the kernel method to overcome these problems.
Section 5: General Stream Processing Model
a. Discuss the components of a General Stream Processing Model. List few sources of Streaming Data.
Ans. Components of a general stream processing model:
- 1. Message broker (Stream processor):
- a. A stream processor constantly streams data for consumption by other components after collecting it from its source and converting it to a common message format.
- b. A component that stores streaming data, such as an ETL tool or a data lake or warehouse.
- c. Stream processors have a fast throughput, but they don’t perform task scheduling or data transformation.
- 2. Batch processing and real-time ETL tools:
- a. Before data can be evaluated with SQL-based analytics tools, it must first be aggregated, processed, and structured from streams coming from one or more message brokers.
- b. An ETL tool or platform performs this by receiving user queries, retrieving events from message queues, and then applying the query to produce a result.
- c. The outcome could be a new data stream, an API call, an action, a visualization, or an alarm.
- d. Apache Storm, Spark Streaming, and WS02 Stream Processor are three examples of open-source ETL solutions for streaming data.
- 3. Data analytics / serverless query engine:
- a. After streaming data is ready for the stream processor to consume, it needs to be analyzed to add value.
- b. Streaming data analytics can be done in a variety of ways. Some of the most popular tools for streaming data analytics are Amazon Athena, Amazon Redshift, and Cassandra.
Sources of streaming data:
- 1. Sensor data:
- a .Sensor data are the information generated by sensors that are located in various locations.
- b. Several sensors, including temperature sensors, GPS sensors, and other sensors, are installed at various locations to record the location’s temperature, height, and other data.
- c. The sensor generates a stream of real numbers as data or information.
- d. The main memory stores the data or information provided by the sensor. Every tenth of a second, these sensors send a significant amount of data.
- 2. Image data:
- a. Daily streams of many terabytes of photos are frequently sent from satellites to earth.
- b. Although surveillance cameras’ image resolution is lower than that of satellites, there can be a lot of them, and each one can create a stream of photos at intervals as short as one second.
- 3. Internet and web traffic:
- a. An Internet switching node receives streams of IP packets from numerous inputs and routes them to its outputs.
- b. The switch’s function is to convey data, not to store it, search for it, or give it greater power.
- c. Different streams are received by websites. For instance, Google gets a few hundred million search requests every day. Yahoo’s numerous websites receive billions of clicks per day.
- d. From streams of data, a lot of information can be gleaned or extracted.
b. Explain and apply Flajolet-Martin algorithm on the following stream of data to identify unique elements in the stream.
S = 1, 3, 2, 1, 2, 3, 4, 3, 1, 2, 3, 1 S = 1, 3, 2, 1, 2, 3, 1, 2, 3, 1
Given: h(x) = (6x + 1) mod 5
Ans. Flajolet-Martin algorithm:
- 1. Create a bit vector (bit array) of sufficient length L, such that 2L > n, the number of elements in the stream. Usually a 64-bit vector is sufficient since 264 is quite large for most purposes.
- 2. The hash i-th bit in this vector/array represents whether we have seen a function value whose binary representation ends in 0. So each bit to 0.
- 3. Generate a good, random hash function that maps input (usually strings) to natural numbers.
- 4. Read input. For each word, hash it and determine the number of trailing bit vector zeros. If the number of trailing zeros is k, set the k-th bit in the to 1.
- 5. Once input is exhausted, get the index of the first O in the bit array (call this R). By the way, this is just the number of consecutive ls plus one.
- 6. Calculate the number of unique words as 2R/𝛟, where 𝛟 is 0.77351.
Numerical:
Given hash function h(x) = (6x + 1) mod 5
S = 1, 3, 2, 1, 2, 3, 4, 3, 1, 2, 3
h(1) = (6 x 1 + 1) mod 5 = 2
h(2) = (6 x 2 + 1) mod 5 = 3
h(3) = (6 x 3 + 1) mod 5 = 4
h(1) = (6 x 1 + 1) mod 5 = 2
h(2) = (6 x 2 + 1) mod 5 = 3
h(3) = (6 x 3 + 1) mod 5 = 4
h(4) = (6 x 4 + 1) mod 5 = 0
h(3) = (6 x 3 + 1) mod 5 = 4
h(1) = (6 x 1 + 1) mod 5 = 2
h(2) = (6 x 2 + 1) mod 5 = 3
h(3) = (6 x 3 + 1) mod 5 = 4
Now, find binary equivalent
h(1) = 2 = (0010)
h(2) = 3 = (0011)
h(3) = 4 = (0100)
h(4) = 0 = (0000)
Trailing zero’s:
h(1) = 1 h(2) = 0 h(3) = 2 h(4) = 4
R(max) = h(4) = 4
Estimate distinct elements (D.E), D.E = 2R = 24 = 16
Section 6: CLIQUE and PROCLUS Clustering
a. Differentiate between CLIQUE and PROCLUS clustering.
Ans.
| S. No. | CLIQUE | PROCLUS |
| 1. | CLIQUE is a density-based and grid-based subspace clustering techniques. | PROCLUS is a usual dimension-reduction subspace clustering techniques. |
| 2. | CLIQUE allows overlap among clusters in different subspaces. | PROCLUS finds non-overlapped partitions of points in the clusters. |
| 3. | The CLIQUE algorithm divides the data space into grids and then identifies dense units. | The PROCLUS algorithm includes initialization, iteration, and cluster refinement |
| 4. | Clusters are then generated from all dense subspaces using the a-priori approach. | Clusters are generated does not use the a-priori approach. |
| 5. | CLIQUE proceeds in a bottom-up manner. | PROCLUS searches subspaces for clusters in a top-down manner. |
| 6. | High-density clusters must be found in the biggest dimensional subspaces, which CLIQUE inescapably finds. | The found clusters help other subsequence studies and can help us understand high-dimensional data. |
| 7. | CLIQUE assigns one object to multiple clusters. | PROCLUS assigns one object to only one cluster. |
b.
| Tid | Items bought |
| 10 | Beer, Nuts, Diaper |
| 20 | Beer, Coffee, Diaper |
| 30 | Beer, Diaper, Eggs |
| 40 | Nuts, Eggs, Milk |
| 50 | Nuts, Coffee, Diaper, Eggs, Milk |
Find all the association rule from the above given transaction with
Given minsup = 50 %, minconf = 50%.
Ans. Frequent item set:
| Items | Frequency | Support value |
| Beer | 3 | 3/5 = 60% |
| Nuts | 3 | 3/5 = 60% |
| Diaper | 4 | 4/5 = 80% |
| Eggs | 3 | 3/5 = 60% |
| Coffee | 2 | 2/5 = 40% |
| Milk | 2 | 2/5 = 40% |
We will remove items coffee, milk because support value of these items is less than 50 %.
Now, make 2-item candidate set
| Items Pairs | Frequency | Support |
| (Beer, Nuts) | 1 | 1/5 = 20% |
| (Beer, Diaper) | 3 | 3/5 = 60% |
| (Beer, Eggs) | 1 | 1/5 = 20% |
| (Nuts, Diaper) | 2 | 2/5 = 40% |
| (Nuts, Eggs) | 2 | 2/5 = 40% |
| (Diaper, Eggs) | 2 | 2/5 = 40% |
We remove items pairs whose support value is less than 50 %.
For Rules:
(Beer, Diaper)
Two rules can be possible
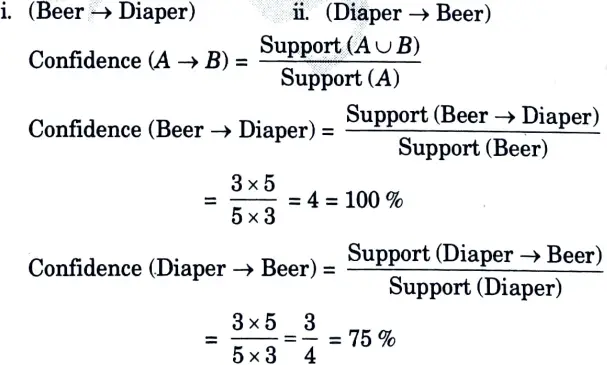
Since, all the rules have confidence more than 50 %. So all the rules are good.
Section 7: Hadoop Distributed File Systems
a. Explain the working of Hadoop distributed file systems.
Ans.
- 1. The Hadoop Ecosystem’s central element or skeleton is the Hadoop Distributed File System.
- 2. HDFS is the one that enables the storage of various kinds of huge data collections (i.e., structured, unstructured and semi structured data).
- 3. HDFS introduces a degree of resource abstraction that allows us to see the entire HDFS as a single entity.
- 4. It enables us to maintain a log file about the stored data and store our data across multiple nodes (metadata).
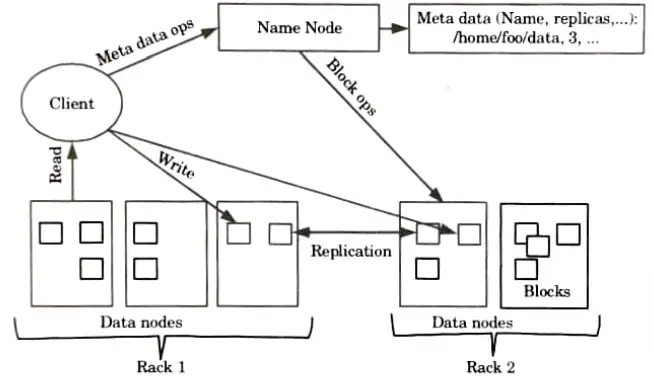
- 5. HDFS has three core components:
- a. Name node:
- i. The name node is the master node and does not store the actual data.
- ii. It includes metadata, or details about databases. As a result, it requires both high computational and low storage requirements.
- b. Data node:
- i. Data node stores the actual data in HDFS.
- ii. It is also called slave daemons.
- iii. It is responsible for read and write operations as per the request.
- iv. It receives request from name node.
- c. Block:
- i. Generally the user data is stored in the files of HDFS.
- ii. In a file system, the file will be split into one or more segments and/or kept in separate data nodes. Blocks are the name given to these file chunks.
- iii. In other words, the minimum amount of data that HDFS can read or write is called a Block.
b. List and explain five R function used in descriptive statistics.
Ans. Five R functions used for computing descriptive statistics:
1. Mean():
- a. It is the sum of observations divided by the total number of observations.
- b. It is also defined as average which is the sum divided by count.
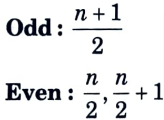
2. Median():
- a. It is the middle value of the data set. It splits the data into two halves.
- b. If the number of elements in the data set is odd then the center element is median and if it is even then the median would be the average of two central elements.
3. Mode():
- a. It is the value that has the highest frequency in the given data set.
- b. The data set may have no mode if the frequency of all data points is the same.
- c. Also, we can have more than one mode if we have two or more data points having the same frequency.
4. Range():
- a. The range describes the difference between the largest and smallest data point in our data set.
- b. The bigger the range, the more is the spread of data and vice versa.
Range = Largest data value – Smallest data value
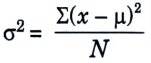
5. Variance():
- a. It is defined as an average squared deviation from the mean.
- b. It is computed by calculating the difference between each data point and the average, also referred to as the mean, squaring the difference, adding all the data points together, and then dividing by the total number of data points in our data set.
6 thoughts on “Data Analytics: Solution of Aktu Question Paper with Important Notes”